


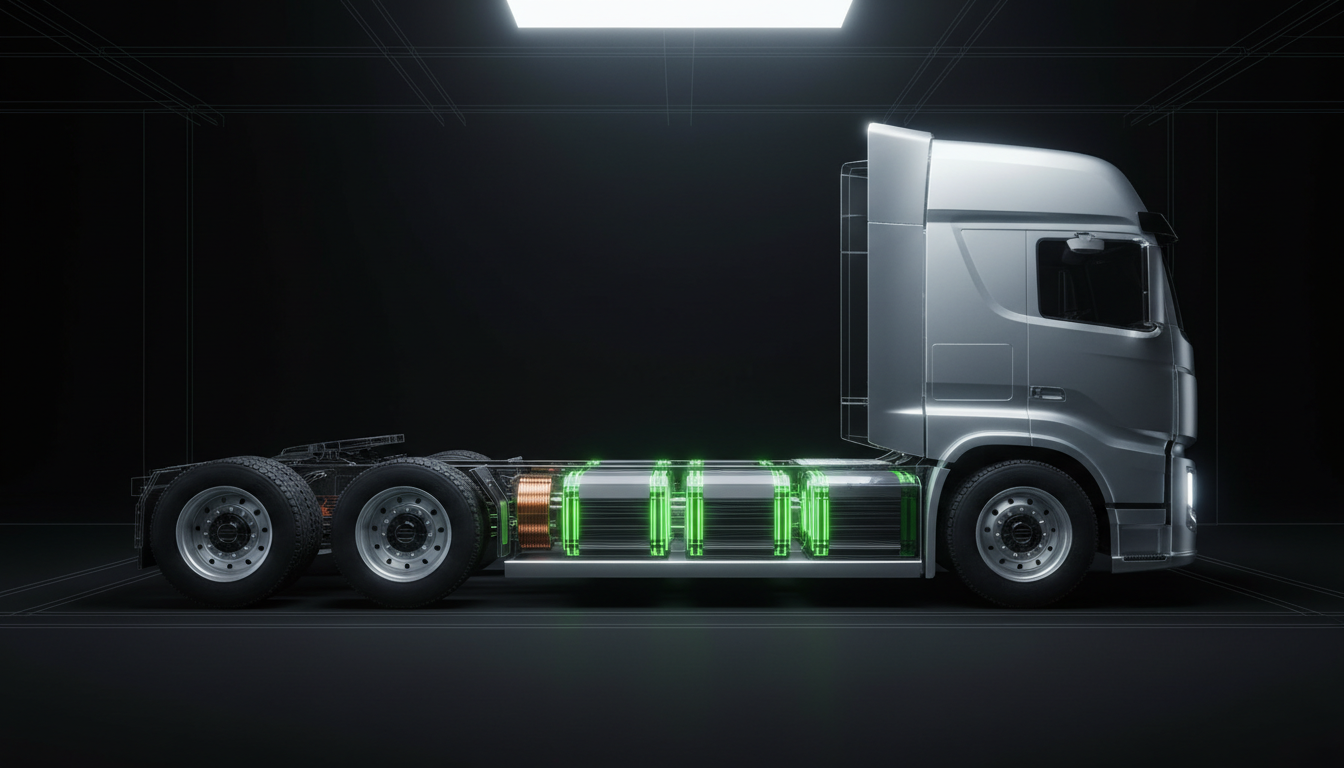
Introduction: The Financial Decoupling of Freight
The global logistics sector stands at a precipice. Therefore, enterprise leaders must rethink legacy financial models. Moreover, the shift from ICE to battery-electric is now economic survival.
This article reframes freight as an energy-management business. Consequently, we analyze CAPEX vs OPEX Heavy-Duty EV Fleets through an AI enterprise lens. Furthermore, automation changes how we model, operate, and profit.
“Look deep into nature, and then you will understand everything better.”— Albert Einstein
In our context, nature is physics. Therefore, understanding energy density reveals true ROI. Additionally, AI automation makes that ROI measurable and predictable.
For context, explore our related analysis in Logistics & Fleet. Also see the full pillar hub: CAPEX vs OPEX Heavy-Duty EV Fleets Lifecycle Cost.
Analytical Verdict: Lifecycle cost analysis proves electrification is a data advantage, not just a green upgrade.
How much does a heavy-duty electric truck cost over its lifetime?
This is the viral question every CFO asks. However, sticker price alone misleads decision makers. Therefore, the real metric is 7-year total cost of ownership.
A diesel Class 8 truck costs ∼$150k upfront. In contrast, a battery-electric Class 8 ranges from $300k to $500k. Nevertheless, operational savings flip the equation within 3-4 years.
Interactive ROI Simulation: Model Your CAPEX vs OPEX Heavy-Duty EV Fleets Lifecycle Cost
Use the live calculator below to model your own CAPEX vs OPEX Heavy-Duty EV Fleets scenario. Therefore, you move from generic estimates to enterprise-grade projections. Moreover, AI automation updates the TCO in real time.
How it works:
- Operations Inputs: Set Fleet Size, Annual Miles, and Horizon (5y/7y/10y/12y). Consequently, you define asset lifecycle.
- CAPEX Inputs: Enter Diesel vs EV truck price, available Credits, and Infra cost per truck. For example, include chargers + BESS amortization.
- Annual OPEX Inputs: Enter Diesel cost per mile vs EV cost per mile + annual maintenance. Therefore, the model captures wear-and-tear savings.
- Live Outputs: The calculator computes Annual OPEX Savings, Payback Period, 10y Net Savings, and CAPEX Premium. Furthermore, the charts show Cumulative TCO and 5-Year Savings vs Spend.
Formula: Annual Savings = (Diesel $/mi - EV $/mi)*Miles + (Diesel Maint - EV Maint) | Payback = Total CAPEX Premium / Annual Savings | Lifetime Net = (Annual Savings ⋅ Horizon) - CAPEX Premium
Model CAPEX premium vs OPEX savings. Live updates.Fleet Electrification ROI
Operations
Annual OPEX
Explore more scenarios in our Logistics & Fleet hub.
Moreover, AI-driven TCO platforms now simulate battery degradation, route energy use, and resale value in real time. Consequently, enterprises move from static spreadsheets to dynamic forecasting.
Financial Verdict: Lifetime cost favors BEV by $45k-$60k annually per truck when energy and maintenance align.
The CAPEX Hurdle: Infrastructure and Hardware Realities
Initially, the CAPEX shock feels massive. The vehicle is only 60% of the initial outlay. Additionally, you must fund charging infrastructure.
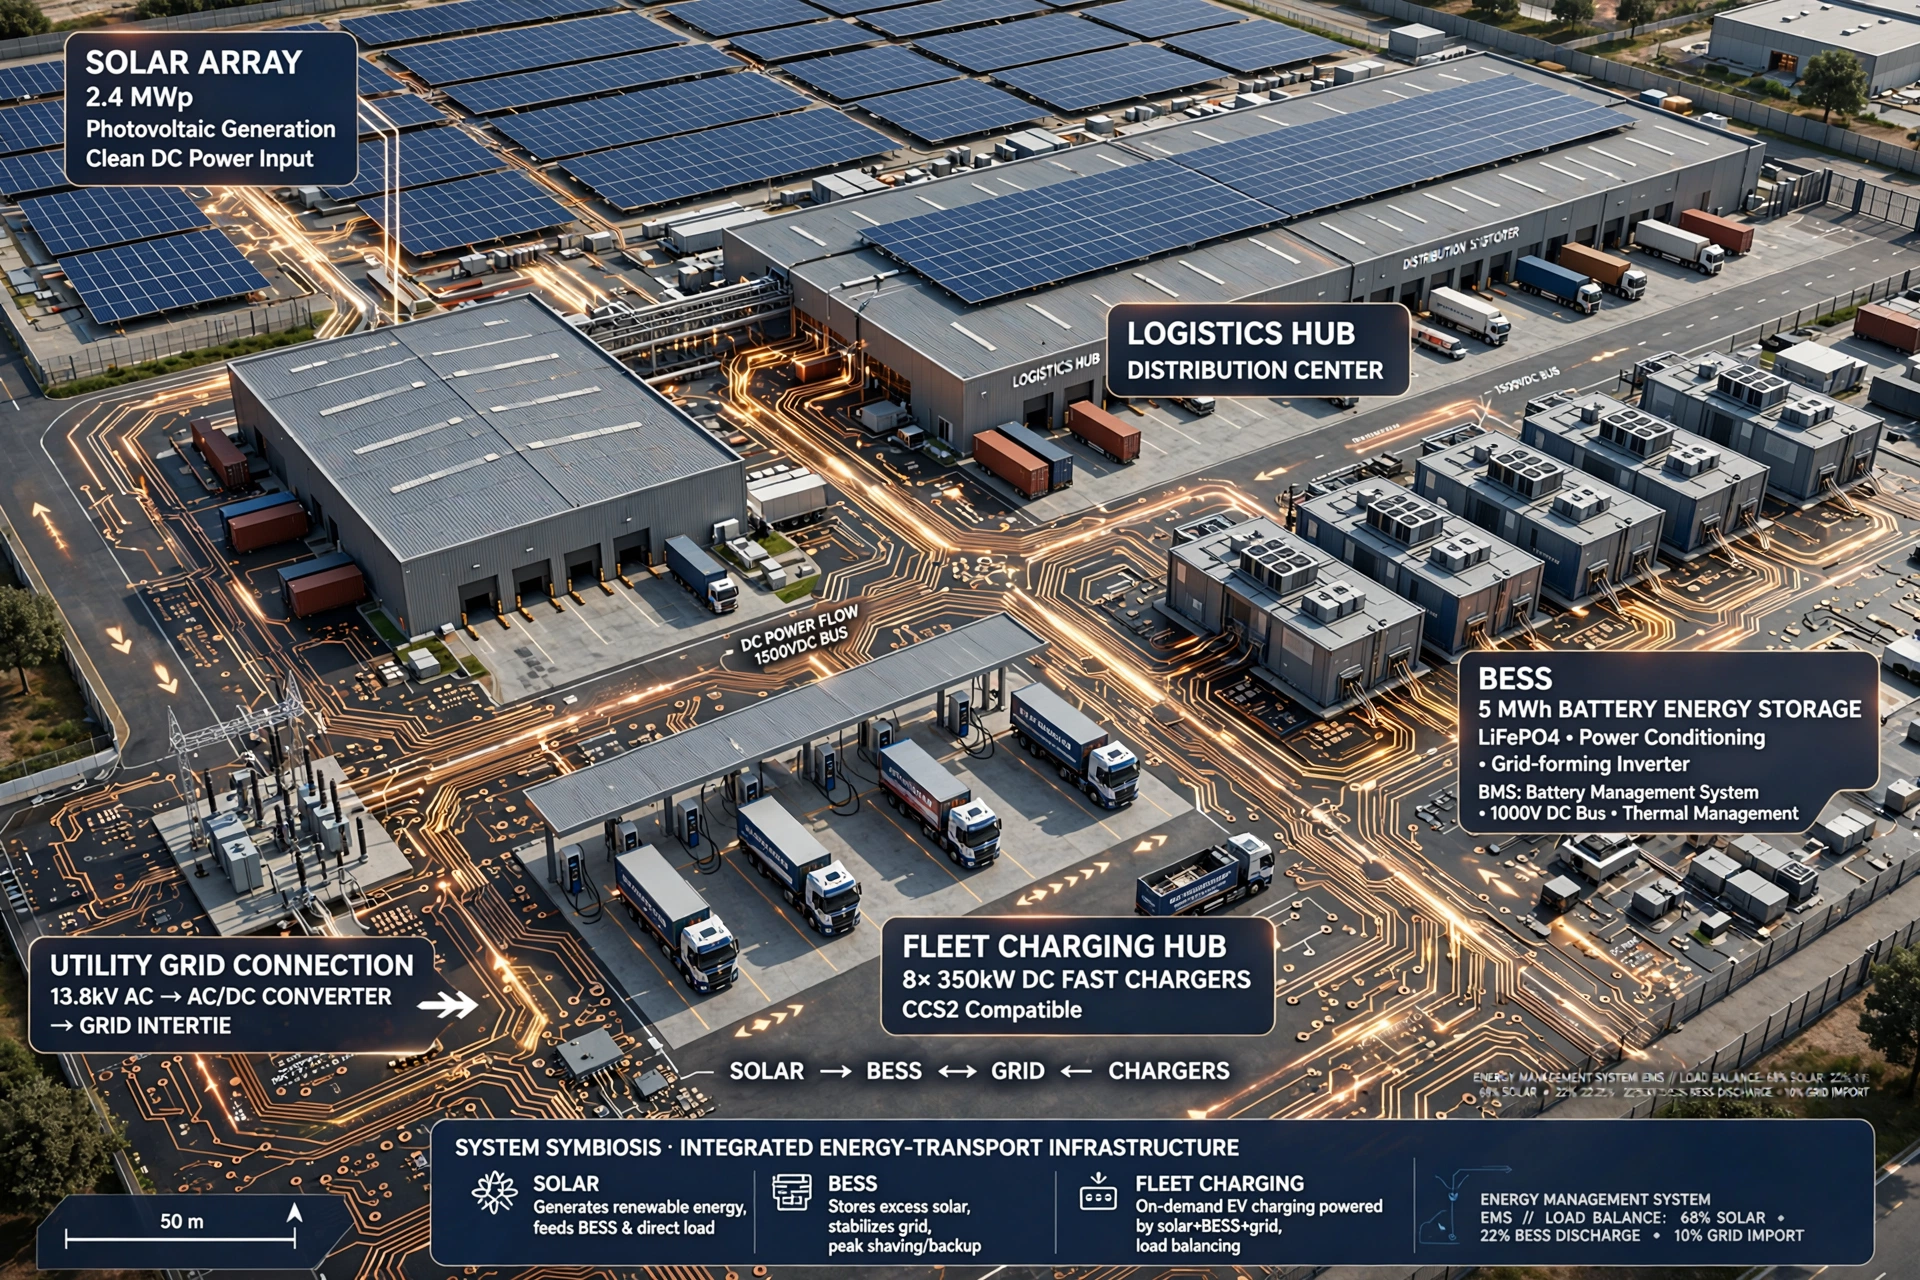
High-power DC fast chargers (350kW+), battery storage (BESS), and grid upgrades define modern depots 1 . Therefore, smart enterprises treat depots as strategic energy assets. Furthermore, these assets serve multiple vehicle generations.
Incentives help bridge the gap. For example, grants now cover up to 80% of incremental cost 1 . Moreover, the Inflation Reduction Act offers up to $40k per clean commercial vehicle 5 .
AI-Powered CAPEX Forecasting and Asset Amortization
AI changes how we amortize CAPEX. For instance, machine learning forecasts charger utilization, peak demand charges, and BESS cycling. Consequently, infrastructure cost per mile drops over time. Moreover, AI models simulate 10-year asset lifecycles versus wear patterns automatically.
Furthermore, enterprises shift from fixed depreciation to dynamic, usage-based amortization. As a result, CAPEX vs OPEX Heavy-Duty EV Fleets planning becomes predictive, not reactive
Furthermore, charging infrastructure lasts 15-20 years. Therefore, it outlives the first truck cycle by 2x. As a result, per-vehicle amortized cost declines with each replacement.
|
Asset Category |
Lifespan |
Initial CAPEX (50-Truck Depot) |
AI Optimization Lever |
Amortized Verdict |
|---|---|---|---|---|
|
Class 8 BEV Truck |
7-8 years |
$18M – $25M |
Predictive battery health extends life 12% |
High upfront, falls after Year 3 |
|
350kW DC Chargers (x12) |
15 years |
$1.2M – $1.8M |
AI load balancing cuts demand fees 30% |
Becomes profit enabler |
|
BESS 5MWh + EMS |
15-20 years |
$1.5M – $2.2M |
Arbitrage + solar shaving |
ROI positive Year 5 |
Financial Verdict: CAPEX is front-loaded but depreciates strategically. Moreover, infrastructure becomes a compounding competitive moat.
The OPEX Dividend: Energy Efficiency and the Maintenance Paradox
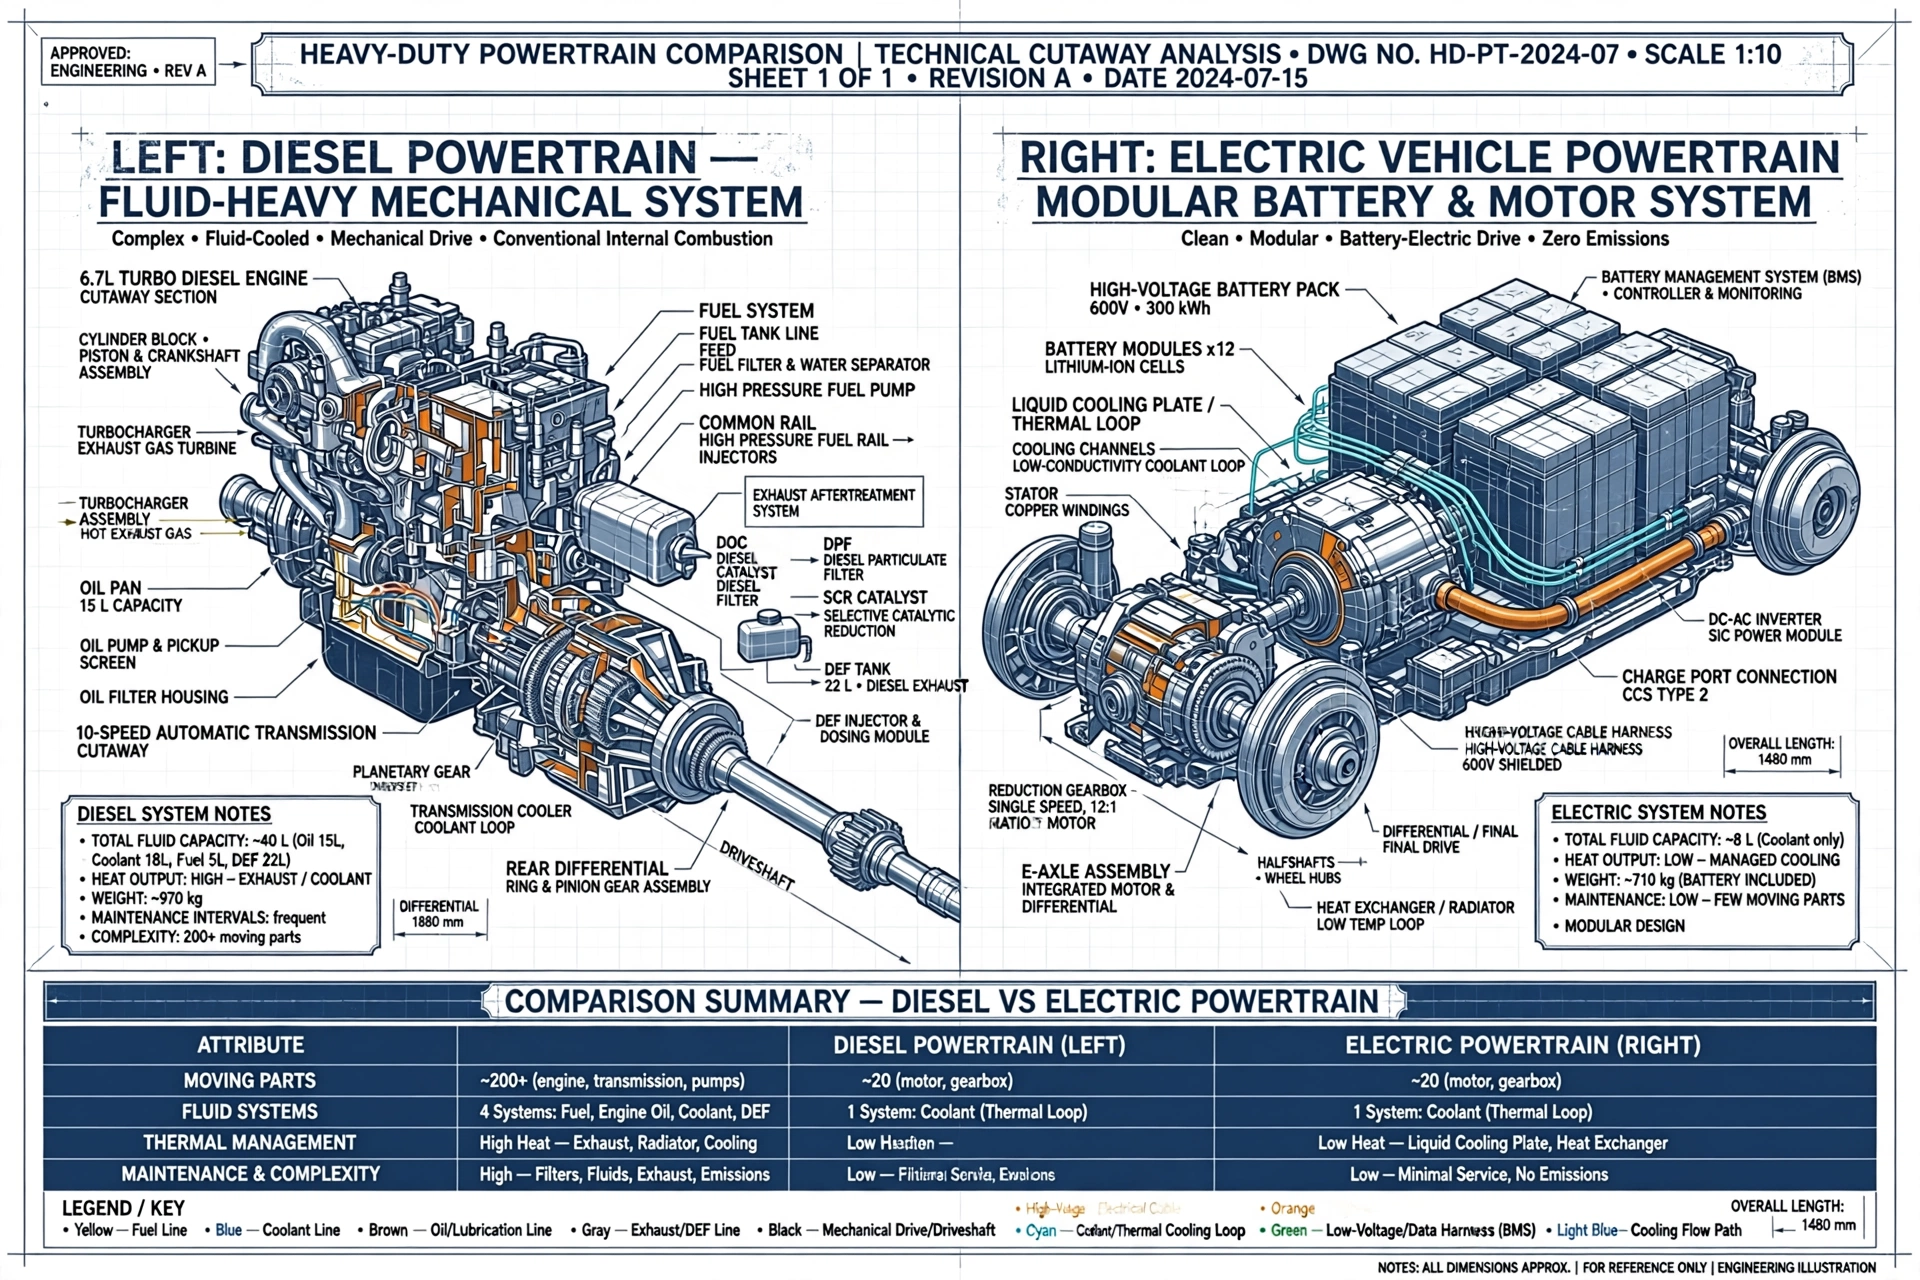
Once operational, the story reverses. Diesel engines waste 60-70% energy as heat. In contrast, electric powertrains convert 90%+ to motion 2 .
Therefore, energy cost per mile drops from $0.70 − $0.95 (diesel) to $0.25 − $0.35 (electric). Moreover, maintenance shrinks dramatically.
An electric motor uses ≈20 moving parts. However, a diesel powertrain uses thousands. Consequently, oil changes, DPF, SCR, and transmission work disappear.
“Luck is what happens when preparation meets opportunity.”— Seneca
Opportunity today is stable electricity pricing 3 . Furthermore, AI locks in that advantage via automated energy procurement.
How AI Automation Slashes Hidden OPEX
AI delivers the real OPEX dividend. For example, predictive maintenance models detect inverter anomalies 300 hours early. Similarly, route AI optimizes for elevation, payload, and temperature 8 . Moreover, AI scheduling prevents costly peak demand spikes automatically. Consequently, fleets cut energy bills by 18-25% without manual intervention
Moreover, regenerative braking cuts brake wear by 50%+. Therefore, uptime rises while cost per mile falls.
|
Component System |
ICE Wear Interval |
BEV Wear Interval |
Lifecycle Replacement |
AI Predictive Impact |
|---|---|---|---|---|
|
Engine / Motor |
15k mi oil, 500k mi overhaul |
No oil, 1M+ mi bearing check |
7-10 yrs vs 10+ yrs |
AI vibration analysis +22% life |
|
Braking System |
50k-80k mi |
150k-250k mi (regen) |
1.5 yr vs 4 yr |
AI brake blending reduces wear 35% |
|
Energy Storage |
Fuel filter 25k mi |
Battery SOH check AI-driven |
5 yr vs 8-10 yr |
AI thermal management saves 18% degradation |
|
Aftertreatment |
DPF/SCR 100k mi |
None |
3-4 replacements vs 0 |
Zero cost, zero downtime |
Financial Verdict: OPEX savings exceed $25M over 10 years for a 50-truck fleet. Moreover, AI extends component life another 12-20%.
Grid Resilience and the Regulatory Landscape
Regulations accelerate this shift. For instance, California ACT mandates 40% zero-emission Class 7-8 sales by 2035 4 . Similarly, EU Regulation 2019/1242 sets strict CO2 limits 5 .
Furthermore, carbon border adjustments and zero-emission zones punish diesel operations. Therefore, compliance becomes a cost driver.
Grid intelligence matters too. AI-driven EMS balances solar, BESS, and grid draw 6 . Moreover, Vehicle-to-Grid pilots show $200k-$500k annual revenue for 50-truck fleets 7 .
“The greatest risk is not taking any risk. In a world that is changing quickly, the only strategy guaranteed to fail is not taking risks.”— Mark Zuckerberg
Analytical Verdict: Regulatory risk costs more than early adoption. Moreover, V2G turns parked trucks into revenue assets.
The Human and Engineering Factor in Fleet Electrification
Engineering must lead, not procurement. Therefore, duty cycles need redesign around charging windows. Additionally, AI dispatch optimizes charge state and payload matching 8 .
Driver training shifts to energy recuperation and thermal management. Similarly, technicians need high-voltage certification. Consequently, human capital investment improves uptime.
“Quality is not an act, it is a habit.”— Aristotle
Quality means data precision. Therefore, use real telematics to model cold-weather range and grade impacts 8 . Moreover, AI twins simulate every route before rollout.
Financial Verdict: Workforce investment lowers insurance and turnover costs 15-25%. Moreover, it prevents costly range failures.
Conclusion: Architecting the Future of Freight
Ultimately, CAPEX vs OPEX Heavy-Duty EV Fleets marks a shift to data-driven energy business. While CAPEX remains high, TCO favors electricity over 7-10 years 9 .
Moreover, inaction carries compounding penalties: carbon taxes, urban bans, ESG pressure 10 . Therefore, leaders must act now.
“The best way to predict the future is to create it.”— Peter Drucker
Logistics powers global commerce. Consequently, electrifying it builds resilience for decades 10 .
Final Financial Verdict: Early electric adopters pay once in CAPEX, then profit annually in OPEX. Therefore, AI-automated fleets will dominate enterprise logistics margins by 2030.
References
Disclaimer: This article is for informational and analytical purposes only. Cost estimates and calculations are based on publicly available data and rough modeling. Consult qualified financial and engineering professionals before making fleet investment decisions.