


Introduction
In modern commercial aviation, the immutable laws of thermodynamics collide directly with the unforgiving realities of corporate balance sheets. For decades, propulsion engineers pursued thermodynamic efficiency as an isolated North Star. Today, amidst volatile fuel markets and stringent carbon mandates, a commercial turbofan is no longer treated as a triumph of metallurgy and fluid dynamics alone; it is evaluated as a complex financial derivative.
Upgrading a fleet’s propulsion architecture represents a calculated hedge: wagering the future value of saved kilograms of kerosene against the massive Capital Expenditure (CAPEX) required for next-generation hardware. Without rigorous financial modeling, thermodynamic gains remain purely theoretical. When operational decision-making is isolated from mechanical reality, even technologically superior aircraft can trigger severe financial underperformance.
To navigate this landscape, aviation management must bridge hangar-floor mechanics with C-suite fiscal strategy. Integrating real-time flight kinematics with enterprise data analytics—often structured within broader AI Enterprise and Aviation Economics initiatives—has become essential for evaluating fleet ROI and preserving flight safety.
Why Do Airlines Spend Millions Replacing Jet Engines That Are Still Perfectly Good?
This question dominates search engines and boardroom discussions alike. From a purely mechanical standpoint, legacy powerplants like the CFM56 or V2600 can be maintained indefinitely through routine shop visits. Yet, airlines routinely retire these reliable engines in favor of multi-million-dollar next-generation architectures such as the LEAP or Geared Turbofan (GTF). The justification lies in the compounding mathematics of the Brayton cycle and specific fuel consumption (SFC).
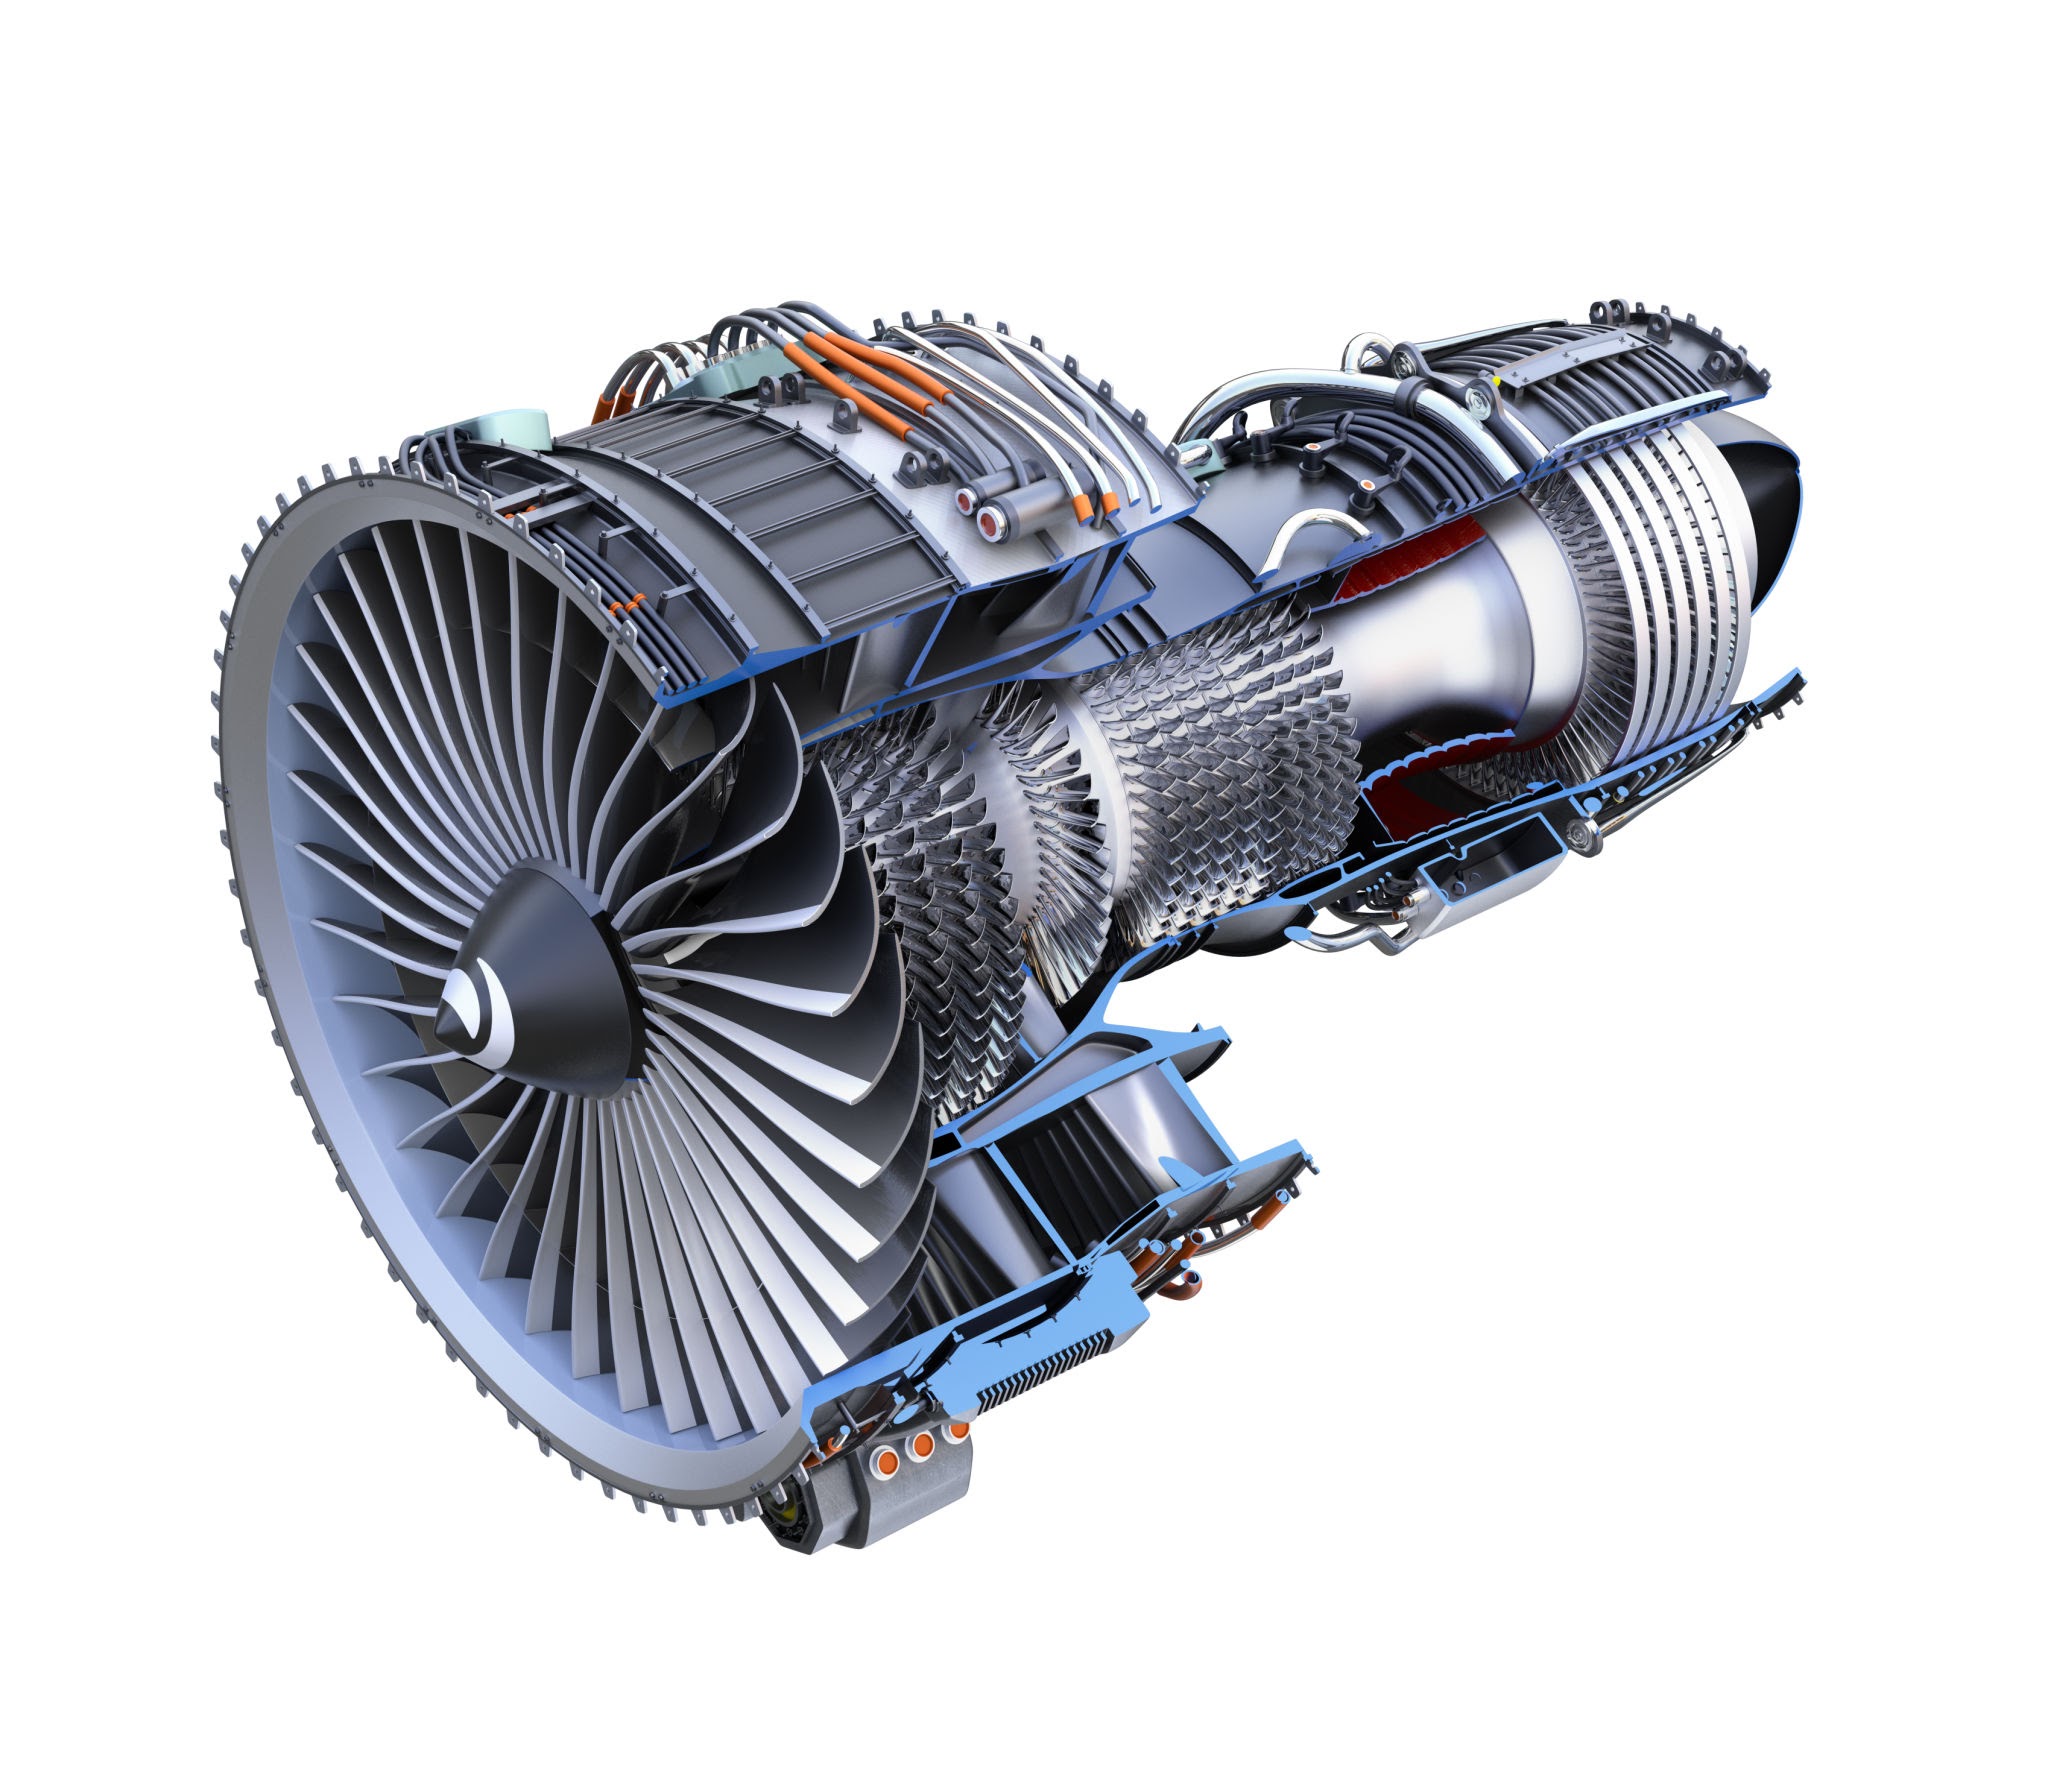
At the core of gas turbine propulsion is the open-cycle Brayton process: atmospheric air is compressed, combined with atomized kerosene, ignited, and expanded across turbine stages to generate thrust 9 . To extract more useful work from this cycle, engineers must drive Overall Pressure Ratios (OPR) upward and push Turbine Entry Temperatures (TET) closer to the stoichiometric limit of the fuel.
“Simplicity is the ultimate sophistication.”— Leonardo da Vinci
In aerospace engineering, simplicity is routinely sacrificed for fractional thermodynamic gains. Achieving a or reduction in SFC requires complex multi-spool architectures, Ceramic Matrix Composites (CMCs), and intricate internal blade cooling labyrinths 1 . When operating temperatures exceed —above the melting point of standard turbine metals—advanced thermal barrier coatings and continuous film-cooling become mandatory to prevent catastrophic structural failure.
While these innovations reduce fuel burn, they alter the operational cost curve non-linearly. The pursuit of peak thermal efficiency introduces higher thermal stresses, accelerating component degradation and shortening the interval between mandatory Maintenance, Repair, and Overhaul (MRO) events.
The Physics of Flight Kinematics: Kerosene Consumption to Weight Ratio
To evaluate the true return on investment (ROI) of a propulsion upgrade, financial models must move beyond static thrust-to-weight ratios and examine dynamic flight kinematics. The relationship between engine efficiency, fuel mass, and total aircraft weight is governed by the Breguet range equation:
$$R = \frac{V}{g \cdot \text{SFC}} \cdot \frac{L}{D} \cdot \ln\left(\frac{W_{\text{initial}}}{W_{\text{final}}}\right)$$
Where:
- $V$ = True airspeed ($\text{m/s}$)
- $g$ = Gravitational acceleration ($9.81\text{ m/s}^2$)
- $\text{SFC}$ = Specific Fuel Consumption ($\text{kg/N}\cdot\text{s}$)
- $L/D$ = Lift-to-drag aerodynamic ratio
- $W_{\text{initial}} / W_{\text{final}}$ = Ratio of takeoff gross weight to landing weight
In long-haul commercial transport, kerosene accounts for $30\%$ to $35\%$ of the aircraft’s Maximum Takeoff Weight (MTOW). Consider a quantitative analysis for a widebody aircraft (e.g., Boeing 787 or Airbus A350 class) operating a standard $10\text{-hour}$ sector:
| Parameter | Legacy Engine Baseline | Next-Gen Engine Upgrade | Delta (Impact) |
|---|---|---|---|
| Initial Takeoff Mass ($W_{\text{initial}}$) | $250,000\text{ kg}$ | $248,800\text{ kg}$ | $-1,200\text{ kg}$ structural/fuel load |
| Fuel Mass ($W_{\text{fuel}}$) | $80,000\text{ kg}$ | $78,800\text{ kg}$ | $1.5\%$ direct reduction |
| SFC ($\text{g/kN}\cdot\text{s}$) | $15.2$ | $14.97$ | $-1.5\%$ thermodynamic gain |
| Kerosene-to-Weight Ratio | $0.3200$ ($32.00\%$) | $0.3167$ ($31.67\%$) | $-0.33\%$ fuel fraction |
Calculating the Operational Cost Reduction
A $1.5\%$ improvement in SFC generates a compounding kinematic benefit known as the mass snowball effect: carrying less kerosene requires less wing lift, which generates less induced drag, further lowering thrust requirements.
- Direct Fuel Savings per Sector:$$\Delta W_{\text{fuel}} = 80,000\text{ kg} \times 0.015 = 1,200\text{ kg per flight}$$
- Annual Kerosene Reduction (at $500$ cycles/year):$$\text{Annual Mass Saved} = 1,200\text{ kg} \times 500 = 600,000\text{ kg}$$Converting mass to volume at a standard kerosene density of $0.80\text{ kg/L}$:$$\text{Annual Volume Saved} = \frac{600,000\text{ kg}}{0.80\text{ kg/L}} = 750,000\text{ liters}$$
- Annual Direct OPEX Reduction (at $\text{\$}0.75\text{/liter}$ spot price):$$\Delta \text{OPEX}_{\text{fuel}} = 750,000\text{ L} \times \text{\$}0.75 = \text{\$}562,500\text{ per aircraft, per year}$$
For a fleet of 40 aircraft, this kinematic optimization translates to $\text{\$}22.5$ in annual direct fuel savings.
To see how these operational efficiencies and meticulous MRO documentation influence broader risk management strategies, explore our detailed methodology on how fleet maintenance records impact aviation liability insurance premiums.
“The goal is not to build the best engine. The goal is to build the most profitable engine over 30,000 cycles.”— Industry Analyst, Jet Propulsion: A Computational Approach
Interactive Academic Laboratory Experience: Brayton Cycle & Cost Simulator
To bridge academic thermodynamic theory with executive financial modeling, simulate the trade-offs of an engine upgrade below. Adjust the physical parameters of the Brayton cycle and global market variables to observe real-time impacts on thermal efficiency () and Net Present Value (NPV) 7 .
Jet Engine Efficiency & OPEX Lab
CAPEX vs. Maintenance Economics: The Risk of Over-Engineering
A fundamental hazard in aviation financial modeling is treating engine performance as a static engineering deliverable rather than a decaying physical asset. A reduction in fuel burn is financially meaningless if the MRO cost per flight hour (CPFH) increases by due to exotic material replacement and premature component wear 2 .

When high-pressure turbine (HPT) blades operate near their thermal creep limits, oxidation and thermal fatigue accelerate. In next-generation engines, replacing a single set of single-crystal, nickel-alloy HPT blades can cost upwards of . Consequently, air carriers increasingly reject self-managed MRO in favor of Original Equipment Manufacturer (OEM) “Power-by-the-Hour” (PBH) maintenance contracts 4 .
“Quality means doing it right when no one is looking.”— Henry Ford
Under PBH agreements, the airline pays a fixed hourly rate to the OEM, transferring the financial risk of unscheduled removals and infant mortality failures back to the manufacturer. However, this insurance carries a substantial premium. Financial modelers must execute rigorous route-network simulations:
-
Short-Haul / High-Cycle Operations: Engines endure frequent takeoffs (maximum thermal and mechanical stress) with brief cruise periods. Here, MRO costs dominate, and PBH contracts often protect operational margins.
-
Long-Haul / Low-Cycle Operations: Engines spend up to of their operating life in steady-state, high-altitude cruise where thermal stress is stable and fuel consumption dominates the cost structure. In this regime, self-managed MRO combined with aggressive thermodynamic upgrades yields the highest Net Present Value 5 .
Risk Mitigation, Safety, and Regulatory Compliance
Operational risk in aviation economics is inseparable from flight safety and international airworthiness mandates. When deploying a new engine architecture, the lack of mature empirical reliability data requires incorporating a substantial Technical Risk Premium into the discount rate of any financial model. Historical industry transitions have shown that unpredicted wear mechanisms—such as powder-metal disk anomalies or thermal barrier coating spallation—can ground fleets and erase projected fuel savings overnight 6 .
To isolate and quantify these risks, modern financial engineering utilizes Monte Carlo stochastic simulations. Rather than relying on deterministic spreadsheet projections, analysts run tens of thousands of randomized scenarios varying:
-
Macroeconomic inputs: Spot kerosene volatility, inflation rates, and currency exchange spreads.
-
Mechanical inputs: Mean Time Between Removals (MTBR), EGT (Exhaust Gas Temperature) margin decay rates, and foreign object damage (FOD) probabilities.
This probabilistic approach defines a realistic risk corridor, enabling operators to establish liquidity reserves and structural exit ramps before capital is committed.
Furthermore, compliance is no longer voluntary. Regulatory bodies enforce strict emissions and safety baselines that dictate fleet turnover schedules:
-
ICAO Annex 16: Mandates progressive reductions in nitrogen oxides () and carbon dioxide emissions, legally penalizing non-compliant propulsion architectures 1 .
-
EASA Regulation (EU) 2018/1139: Establishes rigorous overarching airworthiness and environmental safety rules across European airspace, directly affecting asset residual values 3 .
-
The Cape Town Convention: Provides international legal standardization for repossession and security interests in mobile aircraft engines, reducing debt-financing costs for operators investing in compliant next-generation assets 8 .
“Efficiency is doing things right; effectiveness is doing the right things.”— Peter Drucker
Conclusion: The Convergence of Physics and Capital
The decision to upgrade a commercial jet engine fleet is a masterclass in managing contradictory forces. On one hand, Brayton cycle optimization and reduced fuel mass fractions deliver significant kinetic efficiency, lower emissions, and substantial daily OPEX savings. On the other hand, the extreme temperatures and pressures required to achieve these gains escalate maintenance complexity, supply-chain vulnerability, and capital acquisition costs.
Aviation stakeholders who thrive in low-margin, highly regulated markets do not treat engineering and finance as isolated domains. By grounding financial models in the dispassionate mechanics of flight kinematics, thermal decay curves, and probabilistic risk analysis, operators can successfully navigate the transition to next-generation propulsion. Ultimately, true aerospace leadership lies at the precise intersection where the laws of thermodynamics meet the logic of capital.