



Introduction
In the world of commercial aviation, safety is not merely a priority—it is the foundational principle upon which the entire industry operates. However, maintaining that standard comes at a staggering financial cost that few outside the sector fully appreciate. As global fleets age and regulatory frameworks tighten, the economics of material fatigue testing have become one of the most consequential challenges facing airlines, maintenance organizations, and regulatory authorities worldwide.
Consequently, the global aircraft Maintenance, Repair, and Overhaul (MRO) market was valued at approximately $\text{\$}90.85$ billion in 2024, and it is projected to reach $\text{\$}120.96$ billion by 2030, growing at a compound annual growth rate of 4.75% 1 . A significant portion of this expenditure is driven by the inspection and testing of aging airframes. To truly understand this burden, one must examine it through the lens of Aviation economics—where every hour an aircraft spends grounded for fatigue inspection represents lost revenue, crew displacement, and logistical disruption.
This article abandons superficial industry narratives to examine the true financial cost of aerospace safety compliance from the dispassionate perspective of mechanics, thermodynamics, and rigorous ROI modeling.
Why Do Airlines Spend Millions Fixing Invisible Aircraft Damage? The Real Cost of Flight Fatigue
This is one of the most frequently searched questions in aviation economics. The answer lies not just in regulatory compliance, but in the unforgiving laws of physics. The cost of material fatigue testing varies dramatically depending on the aircraft type, its operational history, and the severity of environmental exposure.
For instance, a single D-check can cost between $\text{\$}1.5$ million and $\text{\$}3$ million and require the aircraft to be out of service for four to eight weeks. Furthermore, when structural fatigue damage is discovered, the costs escalate exponentially. Structural repairs on aging wide-body aircraft can add $\text{\$}500,000$ to $\text{\$}2$ million per event, while replacement of fatigue-compromised fuselage sections has been documented at costs exceeding $5 million 2 .
“You cannot inspect quality into a product. You must build it in from the start.”— W. Edwards Deming, Pioneer of Quality Management
Deming’s observation underscores a fundamental tension in aerospace: even the most rigorous original design eventually succumbs to the relentless physics of cyclic stress.
The Engineering Reality: Mechanics and Thermodynamics of Material Fatigue
To fully calculate the financial dimensions, we must strip away the operational fluff and look at the underlying mechanics and thermodynamics. Material fatigue is a progressive process driven by flight kinematics. Each flight cycle subjects an airframe to extreme pressurization (${\sim}8.6 \text{ psi}$ differential), severe thermal fluctuation (from $+40^\circ\text{C}$ on the tarmac to $-50^\circ\text{C}$ at cruise altitude), and intense aerodynamic loading.
Over time, these repeated stresses initiate microscopic cracks at stress concentration points. From a thermodynamic perspective, the energy dissipated during these cyclic loading events alters the crystalline structure of aerospace-grade aluminum alloys (like 7075-T6).
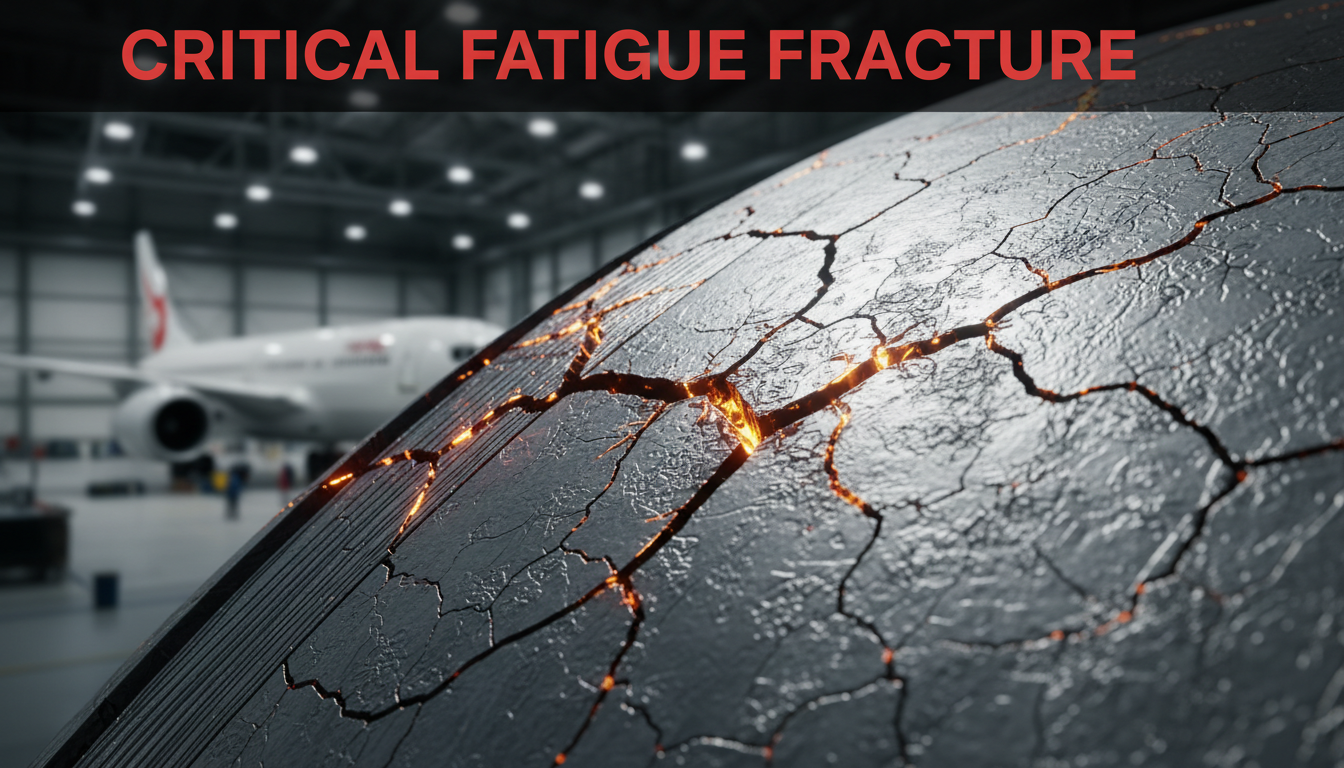
Additionally, studies published in Engineering Failure Analysis show that pre-existing corrosion can reduce the fatigue life of an aircraft wing by as much as 72% under severe conditions 7 . The tragic Aloha Airlines Flight 243 incident in 1988, where a Boeing 737-200 with over 89,000 cycles suffered explosive decompression, forced the industry to transition from a “safe-life” philosophy to a “damage tolerance” methodology.
Flight Kinematics: Calculating the Kerosene Penalty of Structural Repairs
When fatigue is found, the physical repairs—typically structural doublers and reinforced fasteners—add parasitic weight to the airframe. This directly impacts flight kinematics and thermodynamic efficiency.
To calculate the dispassionate ratio of kerosene consumption to weight additions, we utilize a derivative of the Breguet range equation. The additional fuel weight ($\Delta W_f$) required to carry the added structural repair weight ($\Delta W_r$) over a specific flight duration ($t$) is governed by the engine’s Thrust Specific Fuel Consumption ($c_t$) and the aircraft’s Lift-to-Drag ratio ($L/D$):
Scenario Analysis:
Consider an aging twin-engine jet where structural fatigue repairs have added $150 \text{ kg}$ to the Operating Empty Weight (OEW).
-
$c_t$ (TSFC): $16.0 \text{ mg/(N}\cdot\text{s)}$
-
$L/D$: $17$
-
Annual utilization: $3,500 \text{ flight hours}$
Through standard kinematic modeling, every $1 \text{ kg}$ of added weight translates to approximately $35 \text{ kg}$ of additional kerosene burned annually. Therefore, a $150 \text{ kg}$ structural patch results in the burning of an extra $5,250 \text{ kg}$ of fuel per year. At current jet fuel prices, this seemingly minor repair degrades thermodynamic efficiency and directly inflates the Operation cost over the aircraft’s remaining lifespan.
“The most amazing achievement of the computer software industry is its continuing cancellation of the steady and staggering gains made by the computer hardware software.”— Henry Petroski, Civil Engineer and Author
In aerospace engineering, extraordinary advances in materials science are continuously counterbalanced by the relentless physical reality of fatigue and the resultant weight penalties of mitigating it.
Interactive Laboratory: The Economics of Structural Degradation
To truly grasp this concept, we must model it. Below is an interactive simulation—resembling an academic university laboratory experience combined with business and finance bar graphics. By adjusting the aircraft’s age (cycles), the crack propagation rate, and your chosen inspection investment, you can observe the direct correlation between structural degradation, reactive repair costs, and predictive ROI.
(Note for webmasters: To integrate custom interactive ROI calculations directly into your CMS natively, you can utilize the following PHP shortcode snippet to render a simplified backend calculation for your readers.)
Fuel Penalty Calculator
Estimate annual operating cost impact from structural repair weight.
Regulatory Mandates and Their Escalating Economic Impact
The regulatory framework governing fatigue testing is increasingly demanding. In the US, the Aging Airplane Safety Rule (AASR) under 14 CFR §§ 121.370a and 129.16 requires supplemental structural inspection programs 4 . Furthermore, the Widespread Fatigue Damage (WFD) Rule (14 CFR § 26.21) establishes strict operational limits where multiple cracks interact to compromise residual strength 5 .
The Aggregate Cost of Compliance:
| Regulatory Action | Average Cost per Aircraft | Fleet-Wide Impact Example (100 Aircraft) |
| Standard AD Inspection | $7,650 – $15,000 | $1,500,000 |
| WFD Corrective Modification | $50,000 – $200,000 | $20,000,000 |
| Aircraft-on-Ground (AOG) | $50,000 – $150,000 / day | N/A (Highly Variable) |
“What gets measure gets managed. What gets managed gets improved.”— Peter Drucker, Management Theorist
Drucker’s principle is deeply relevant here. The rigorous measurement of structural fatigue has demonstrably improved safety, but it generates an inescapable financial cost.
Risk Calculus: When Compliance Costs Exceed Residual Value
The most critical financial decision an airline faces is identifying the point at which continued compliance becomes economically irrational. This is a risk management calculation balancing safety, thermodynamics, and asset depreciation.
When an aging narrow-body aircraft with a residual value of $3–5 million requires a $2 million D-check combined with $1.5 million in structural fatigue repairs—and introduces the aforementioned aerodynamic fuel penalties—the economic equation fails.
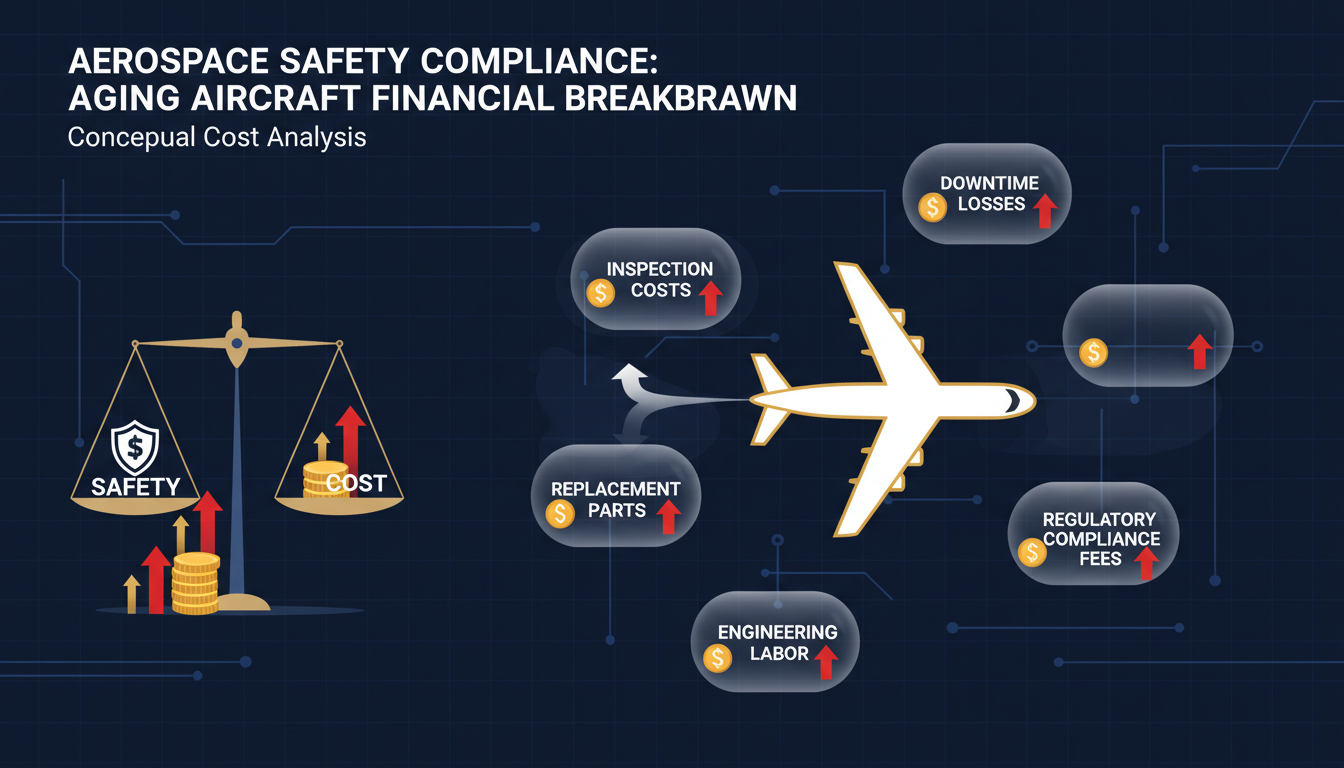
The financial architecture of aerospace safety compliance. Material fatigue testing represents only the visible portion of a much larger economic iceberg — encompassing downtime, engineering labor, regulatory fees, parts procurement, and opportunity costs. (Image: AI-generated illustration | Review: Editorial Engineering)
“Risk comes from not knowing what you’re doing.”— Warren Buffett, Chairman, Berkshire Hathaway
The airlines that most effectively manage this risk invest in predictive analytics and data-driven maintenance planning, transforming material fatigue testing from a mere expense into a vital investment in risk mitigation.
Future Trajectories: The Economics of Structural Health Monitoring
Looking forward, the economics of material fatigue testing are being reshaped by Structural Health Monitoring (SHM) systems. Embedded sensor networks that continuously monitor strain and acoustic emissions in real-time are shifting the industry from reactive inspections to predictive modeling.
By utilizing AI to forecast crack initiation, airlines can avoid the unnecessary weight additions of premature structural doublers, thereby preserving the original thermodynamic efficiency of the airframe and vastly improving the aircraft’s operational ROI.
Conclusion
The true financial cost of material fatigue testing in aging aircraft is the economic expression of a collective decision that human life is not negotiable. Measured in billions of dollars annually, it is one of the most significant investments in public safety.
However, recognizing its necessity does not excuse financial or mechanical inefficiency. By applying rigorous thermodynamic calculations and leveraging AI-driven SHM systems, the industry can optimize these costs. Airlines that embrace this transition will not only reduce their financial exposure but will define responsible stewardship of aging aircraft in the 21st century. In aerospace, the cost of safety is always less than the cost of its absence.
“A designer knows he has achieved perfection not when there is nothing left to add, but when there is nothing left to take away.”— Antoine de Saint-Exupéry, Aviator and Author