



However, the global manufacturing sector stands at a critical juncture where environmental stewardship directly intersects with fiscal survival. Currently, carbon capture infrastructure is no longer a peripheral experiment. Instead, it has become the central pillar of the new industrial economy within the sustainable transition.
To evaluate its true value, we must look beyond the initial price tag. Consequently, leaders must analyze the symbiotic relationship between capital expenditure (CAPEX) and long-term operational resilience.
This structured analysis equips factory owners, plant engineers, ESG officers, and infrastructure investors with precision data. Ultimately, these critical insights allow them to make confident, highly profitable capital allocation decisions.
“The best way to predict the future is to create it.”— Peter Drucker
Within Green Tech & Infra, creating the future demands brutal honesty about the financial mechanics of clean air. Transitioning to a net-zero framework involves significant structural shifts. However, these massive shifts catalyze a unique form of “Carbon Alpha.”
Specifically, this represents the ability to generate superior financial returns through decarbonized operational efficiency 1 . As a result, manufacturers who act strategically position themselves as indispensable market leaders.
Moreover, climate target urgency has dramatically accelerated governmental incentive structures worldwide. Therefore, understanding carbon capture infrastructure costs has shifted into a pressing operational imperative.
This article examines three interconnected pillars of the sustainable transition. First, we explore the CAPEX conundrum of initial build-outs. Second, we analyze the OPEX energy penalty and its trajectory of decline. Finally, we dissect the emerging dual-track profitability thesis built on ESG capital access.
Verdict: Carbon capture infrastructure costs are projected to fall by 35–50% between 2023 and 2035, driven by modular construction and economies of scale. Thus, early adoption secures an unbeatable, long-term structural cost advantage.
Why Are Manufacturers Losing Millions by Delaying Carbon Capture Infrastructure?
This is the decisive question that every CFO and industrial engineer must confront. Delaying investment frequently seems financially prudent in the short term. However, the data reveals a deeply nuanced and highly encouraging reality for proactive firms.
How much does carbon capture infrastructure really cost for modern manufacturing plants?
This is the decisive question every CFO and plant engineer must answer before committing capital. However, the answer is more nuanced and more encouraging than headlines suggest.
Carbon capture infrastructure costs are projected to fall 35–50% between 2023 and 2035. Additionally, this decline mirrors offshore wind a decade earlier. The drivers are modular construction, improved solvent chemistry, and global scale.
Therefore, the financial model changes completely when you model total lifecycle, not just upfront cost.
Interactive Simulator: Test Your Plant’s Numbers
How it works: This live model calculates your CAPEX, OPEX energy penalty, 45Q tax credit, carbon price avoidance and C2V revenue in real-time.
What it means: Green flow = profitable. Red flow = OPEX heavy. Payback and 10Y NPV update instantly.
Tip: Drag any slider on the left to see the impact — try lowering electricity cost or raising C2V price.
Interactive CAPEX / OPEX Simulator | ESG Efficiency Moat • Green Tech & InfraCarbon Capture Infrastructure: Hidden Costs vs Long-Term Profitability
How to Calculate OPEX, CAPEX, and ROI — The System Equations:
-
Dynamic Velocity Control: Particle animation speed ($v$) across the Plant $\rightarrow$ Absorber $\rightarrow$ Compressor $\rightarrow$ Storage/C2V pipelines is directly bound to mass flow rate ($\dot{m}_{\text{CO}_2}$).
-
OPEX & Energy Physics: Calculates specific energy consumption ($\text{kWh/t}$) derived from the energy penalty %, multiplying by grid electricity costs ($\text{\$/MWh}$) and adding fixed annual maintenance ($4\%$ of CAPEX).
-
Revenue Stacking: Integrates Section 45Q tax credits, Carbon to Value (C2V) synthetic fuel sales, and avoided EU ETS / compliance carbon costs.
-
Capital Budgeting Metrics: Real-time computation of Net Annual Profit, Payback Period ($\large t_{\text{payback}} = \frac{\text{CAPEX}}{\text{Net Profit}}$), and 10-Year Net Present Value (NPV) discounted at a 6% WACC:
$$\large \text{NPV} = -\text{CAPEX} + \sum_{t=1}^{10} \frac{\text{Net Cash Flow}_t}{(1 + 0.06)^t}$$
The CAPEX Conundrum: Architecting the Initial Investment
Building a carbon capture plant serves as a masterclass in heavy engineering and financial foresight. Initially, the capital expenditure appears daunting to stakeholders conditioned to view sustainability as a sunk cost. Nevertheless, visionary leaders increasingly recognize these assets as foundational infrastructure for global ESG market access.
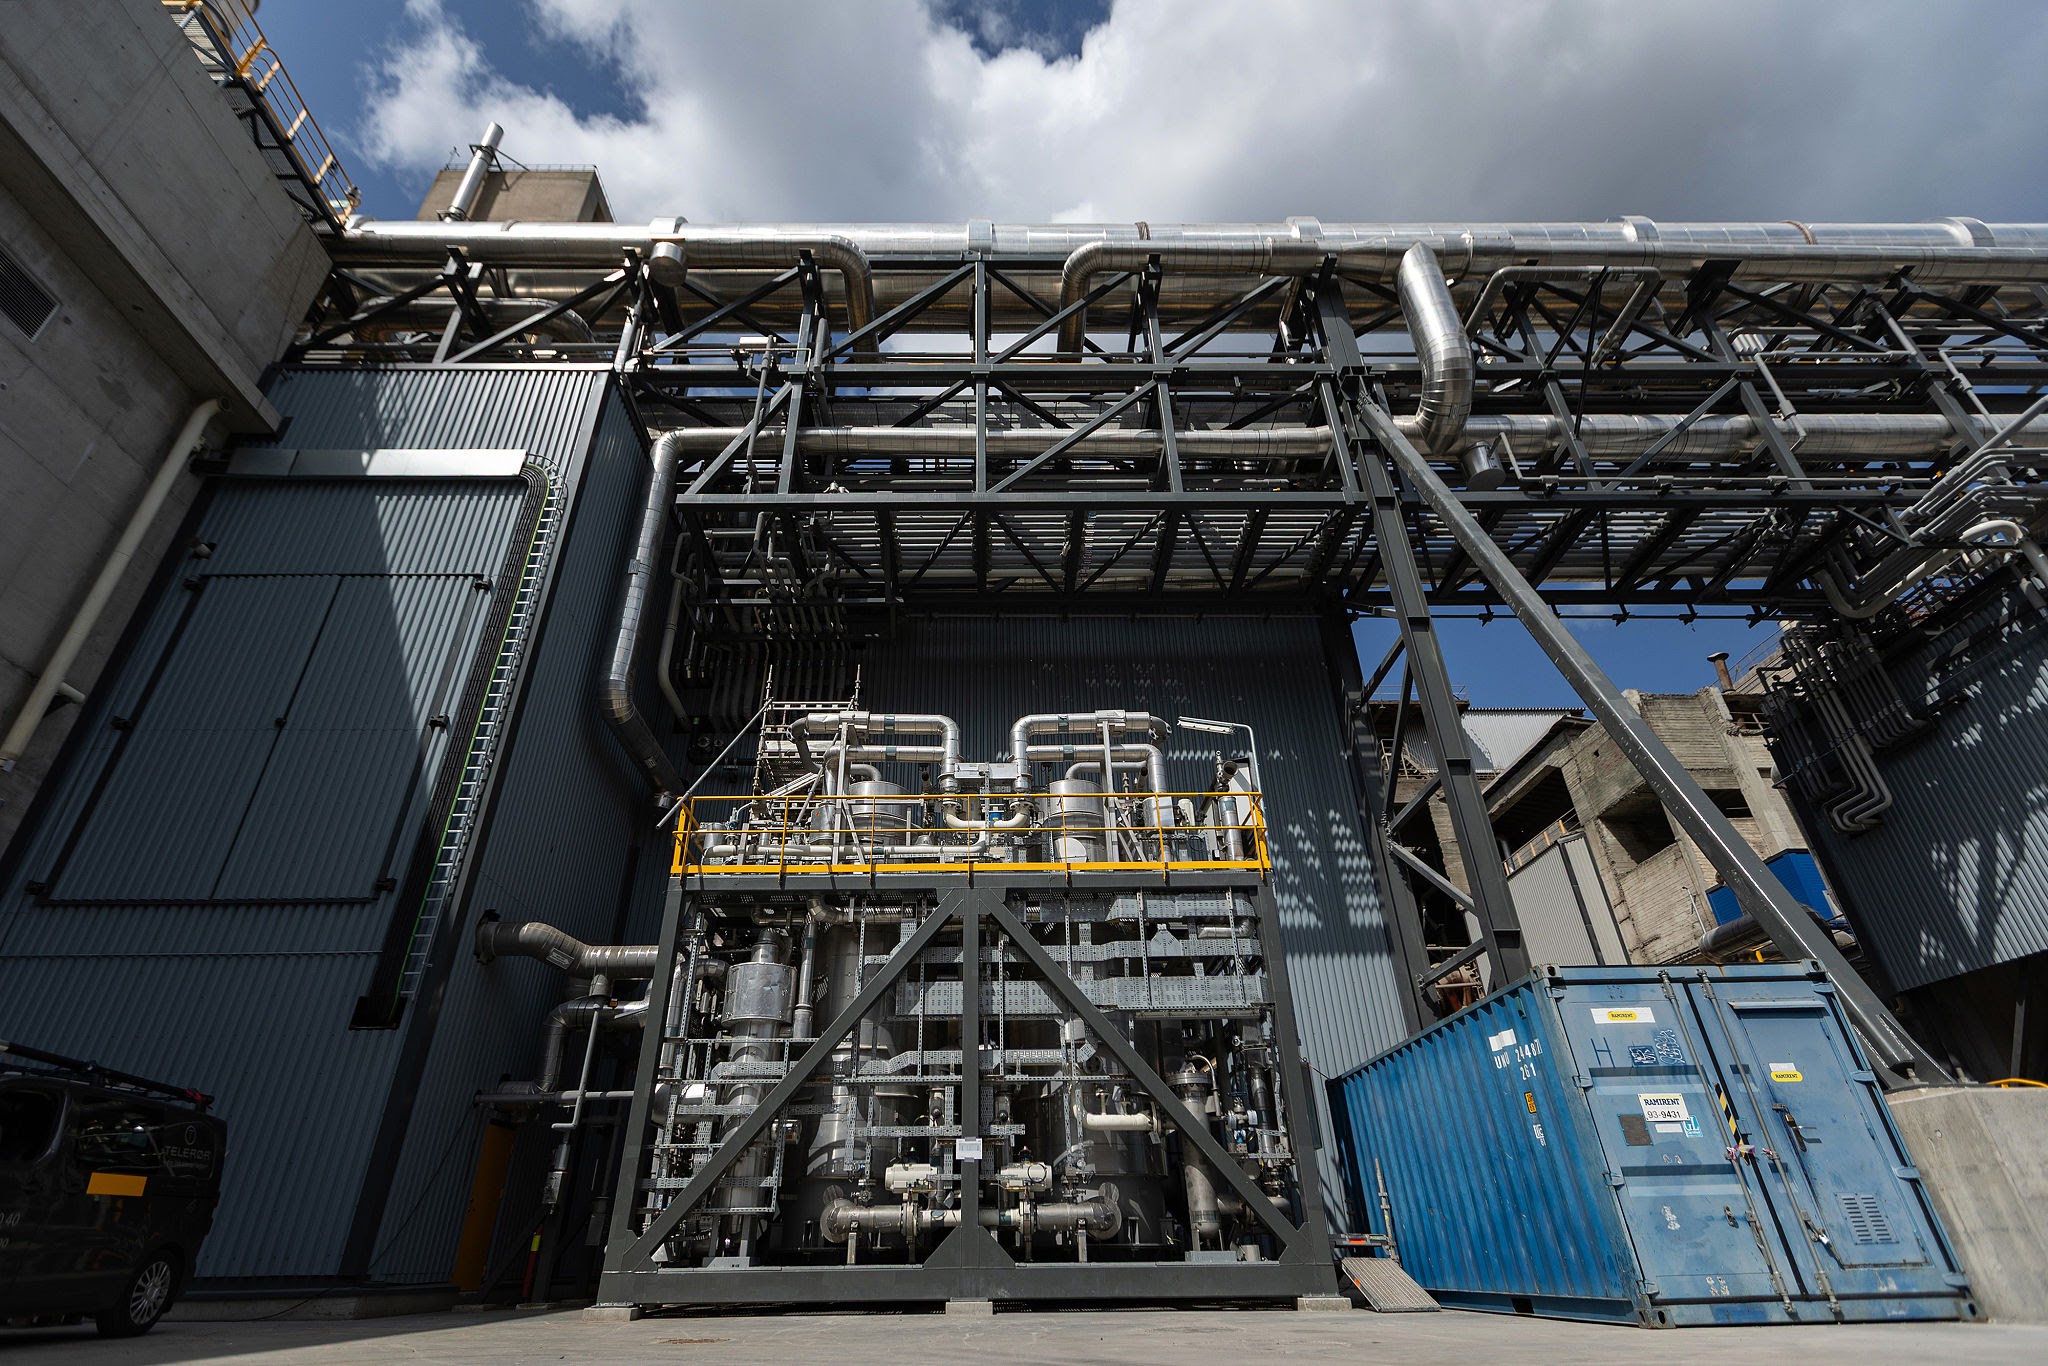
Furthermore, the competitive landscape is shifting incredibly fast. Delayed investment directly translates into compounding regulatory penalties and swift market exclusion. The primary cost components reside in the capture units, compression systems, and pipeline infrastructure.
Modern engineering has introduced modular prefabricated designs that allow highly scalable, phased implementation. In addition, prefabrication reduces field installation timelines from years to mere months. Consequently, this critical innovation significantly compresses the payback period and lowers financing risk.
“Efficiency is doing things right; effectiveness is doing the right things.”— Peter Drucker
By investing in high-efficiency capture technology early, manufacturers actively avoid severe “Carbon Tax” exposure traps. Crucially, the US Internal Revenue Code § 45Q provides up to $85 per tonne for geological sequestration 2 . Therefore, the high upfront cost effectively functions as a brilliant strategic financial hedge.
Additionally, over 40 commercial-scale projects entered final investment decisions in 2023 alone 6 . This unprecedented surge reflects a genuine maturation of modern financing mechanisms. Similar to how companies evaluate CAPEX vs OPEX in heavy-duty EV fleets, industrial leaders must calculate comprehensive lifecycle returns.
Verdict: The CAPEX barrier is increasingly bridgeable through intelligently structured capital markets. Consequently, firms treating this as core production infrastructure will completely define the next decade of industrial leadership.
Analyzing OPEX: The Energy Penalty and the Efficiency Curve
Operational Expenditure (OPEX) in carbon capture is primarily dominated by the “energy penalty.” Specifically, this represents the additional electricity required to separate concentrated CO₂ from dilute flue gases. While these parasitic costs are real, continuous technological maturation systematically offsets them.
Accordingly, the narrative around OPEX has decisively shifted across the sector. It is no longer a permanent burden but a declining variable cost with a clear optimization pathway. Manufacturing leaders must therefore aggressively adopt a “Total Cost of Ownership” perspective.
Moreover, renewable energy costs continue to plummet globally at record rates 3 . Consequently, the OPEX of running carbon capture units becomes increasingly manageable within standard budgets. Integrating onsite renewable power creates a closed-loop system that drastically slashes operational overhead.
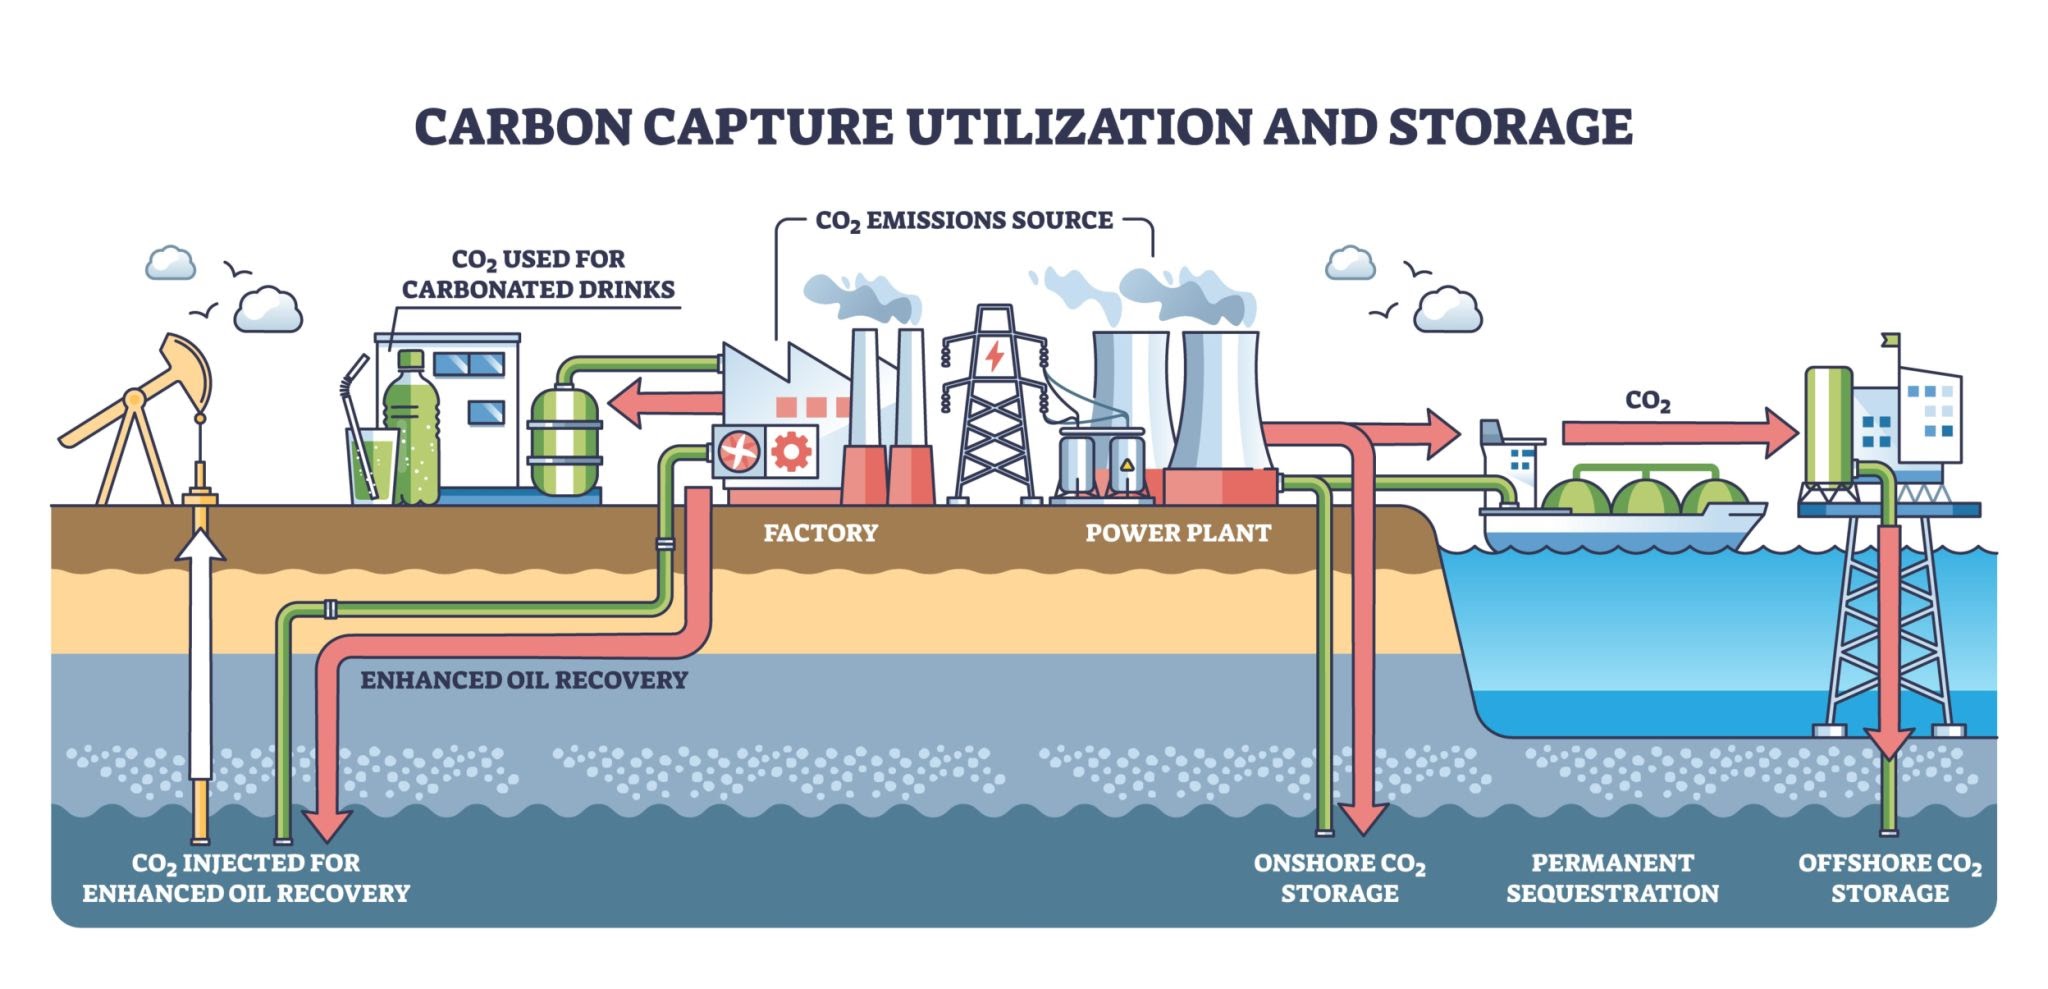
“In the middle of difficulty lies opportunity.”— Albert Einstein
This strategic energy transition ensures manufacturers remain fiercely competitive. Furthermore, carbon-heavy products face mounting penalties from consumers and institutional lenders alike. Firms coupling renewable procurement with carbon capture naturally achieve a durable “efficiency moat.”
Additionally, next-generation solid-sorbent technologies actively reduce regeneration energy requirements by up to 40%. As a result, parasitic energy loads are currently trending toward a much lower 15–18% range.
Verdict: The energy penalty crossover—where renewables make capture cheaper than carbon taxes—will hit by 2028. Therefore, locking in efficiency gains right now acts as a powerful, mathematically proven barrier to entry.
Monetizing ESG: The Structural Shift to Profitability
Profitability in green tech is fundamentally being redefined by ESG performance scores. High-quality carbon capture infrastructure measurably improves a company’s financial risk profile. Specifically, it heavily reduces physical climate risk and establishes transparent governance frameworks.
As a result, firms with robust sequestration systems consistently enjoy lower borrowing costs. They uniquely benefit from “Green Bond” issuances and highly favorable institutional covenants.
Carbon-to-Value (C2V) Revenue Pathways
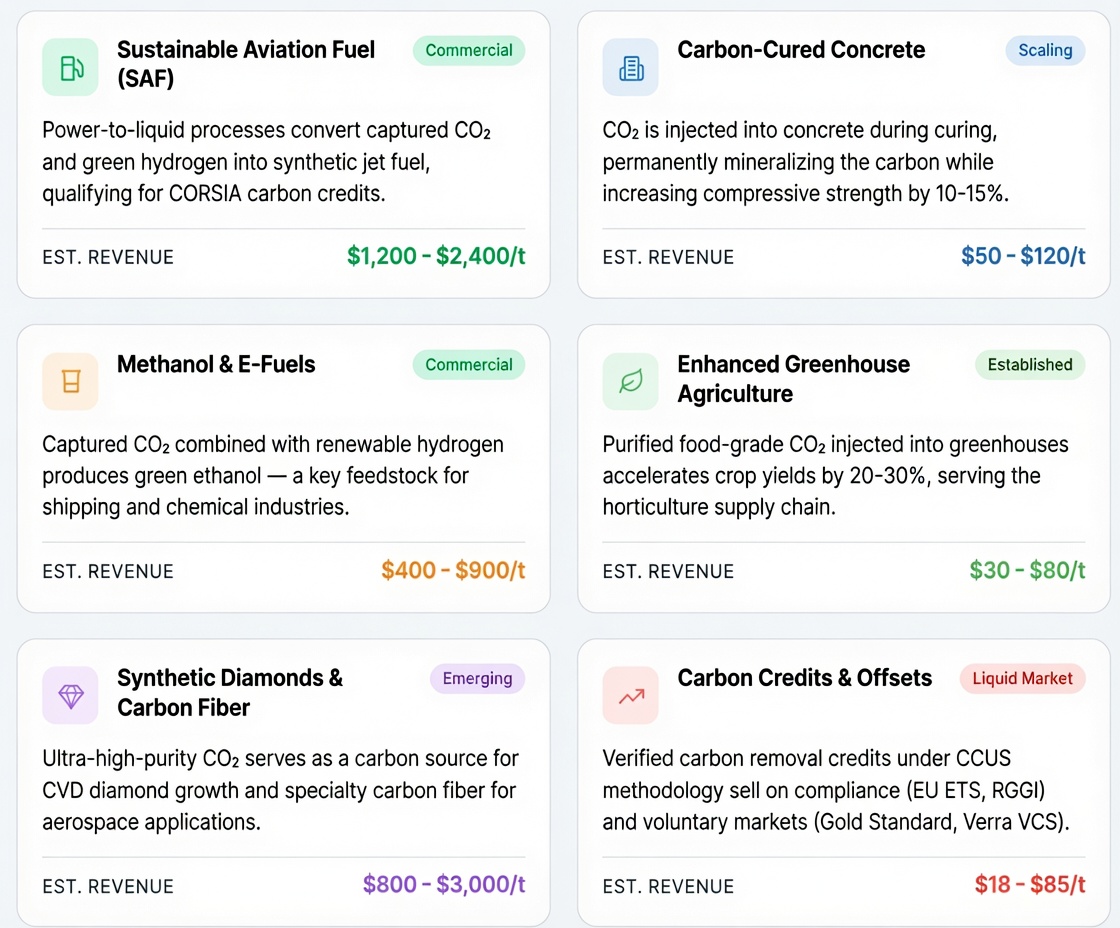
Transforming captured CO₂ from a liability into a diversified revenue stream furthermore, the captured carbon itself is rapidly becoming a highly diversified commodity portfolio. From “Carbon-to-Value” (C2V) applications to sustainable aviation fuel, captured CO₂ literally creates a multi-billion-dollar revenue stream 4 .
“Innovation is the specific instrument of entrepreneurship… the act that endows resources with a new capacity to create wealth.”— Peter Drucker
In this arena, the core innovation lies in turning an industrial liability into a tradable asset. This strategic repositioning creates an incredibly compelling dual-track ROI framework. Specifically, it perfectly balances regulatory risk mitigation with active new product market development 5 .
According to recent data, compliance carbon markets recently reached a historic $95 billion record. Meanwhile, voluntary markets continue attracting massive blue-chip buyers seeking credible offset pathways.
The Bottom Line: A mid-sized manufacturer capturing 500,000 tonnes annually could easily generate over $40M from tax credits alone. Consequently, decarbonization structurally transitions from a punitive cost center into a pure profit center.
Final Considerations
The rigorous evaluation of carbon capture infrastructure reveals a profoundly commercial truth. Specifically, the hidden costs of inaction far outweigh the quantifiable costs of implementation.
While CAPEX requirements remain significant, the rapidly evolving OPEX efficiency curve creates a highly compelling narrative. In addition, the explosive rise of carbon-to-value markets guarantees long-term industrial profitability.
“We do not inherit the earth from our ancestors; we borrow it from our children.”— Native American Proverb
Manufacturing engineers must view carbon capture systems strictly as internal operational upgrades. Consequently, these vital upgrades fundamentally enhance the resilience and longevity of their industrial processes. We are clearly entering an era where the most profitable enterprises maintain the smallest atmospheric footprints.
Ultimately, the strategic question facing industrial leadership has definitively shifted. It is no longer about affording the investment in the sustainable transition. Instead, leaders must seriously ask if they can survive the compounding regulatory costs of ignoring it.
Final Verdict: For leaders who embrace this shift with analytical rigor, carbon capture infrastructure is never a burden. Rather, it represents the most intelligent, financially secure entry fee to a highly resilient and profitable industrial future.