



In the high-stakes theater of Tier-1 manufacturing, inventory serves as a double-edged sword. It protects against volatility, yet simultaneously drains essential working capital. Furthermore, the gap between perceived safety and true operational resilience widens annually.
Peter Drucker famously noted, “What gets measured, gets managed,” but measurement alone fails during global disruptions 1 . Therefore, modern supply chains must evolve beyond legacy metrics toward predictive, algorithmic precision.
This Case Studies analysis examines a global Tier-1 automotive supplier facing a systemic capital crisis. Specifically, arbitrary heuristics dictated their safety stock, freezing millions in dormant assets.
By implementing Algorithmic Inventory Sizing, the firm definitively shifted from reactive buffering to proactive optimization. Ultimately, this data-driven transition unlocked a 14% reduction in total overhead costs while maintaining perfect service levels.
How Can Companies Use AI to Prevent Supply Chain Disruptions Before They Occur?
This viral question currently drives the strategic vision of logistics leaders worldwide. Consequently, the answer lies firmly within the sophisticated data architecture of Algorithmic Inventory Sizing.
The Entropy of Excess: The Cost of Conventional Safety Stock
Traditional inventory management relies heavily on static formulas and outdated assumptions. However, these baseline models consistently fail to capture the non-linear realities of modern lead-time variability. In addition, they entirely ignore geopolitical disruptions and sudden demand spikes.
As a result, the analyzed supplier carried a 22% surplus in non-moving parts simply to mitigate stockout anxiety. Every dollar locked in unnecessary inventory directly drains critical funding for research and automation.
Moreover, warehousing, insurance, and depreciation aggressively compound this financial burden over time. According to the SCOR Model, annual carrying costs routinely consume 20% to 30% of total inventory value 8 .
“Inventory is any money that the system has invested in purchasing things which it intends to sell.”— Eliyahu M. Goldratt,Father of the Theory of Constraints 2
As Goldratt articulated, trapped capital actively suffocates organizational expansion. Therefore, leveraging stochastic modeling uncovers the exact mathematical “Goldilocks Zone” of necessary stock.
Quantitative Resolution: The Algorithmic Pivot
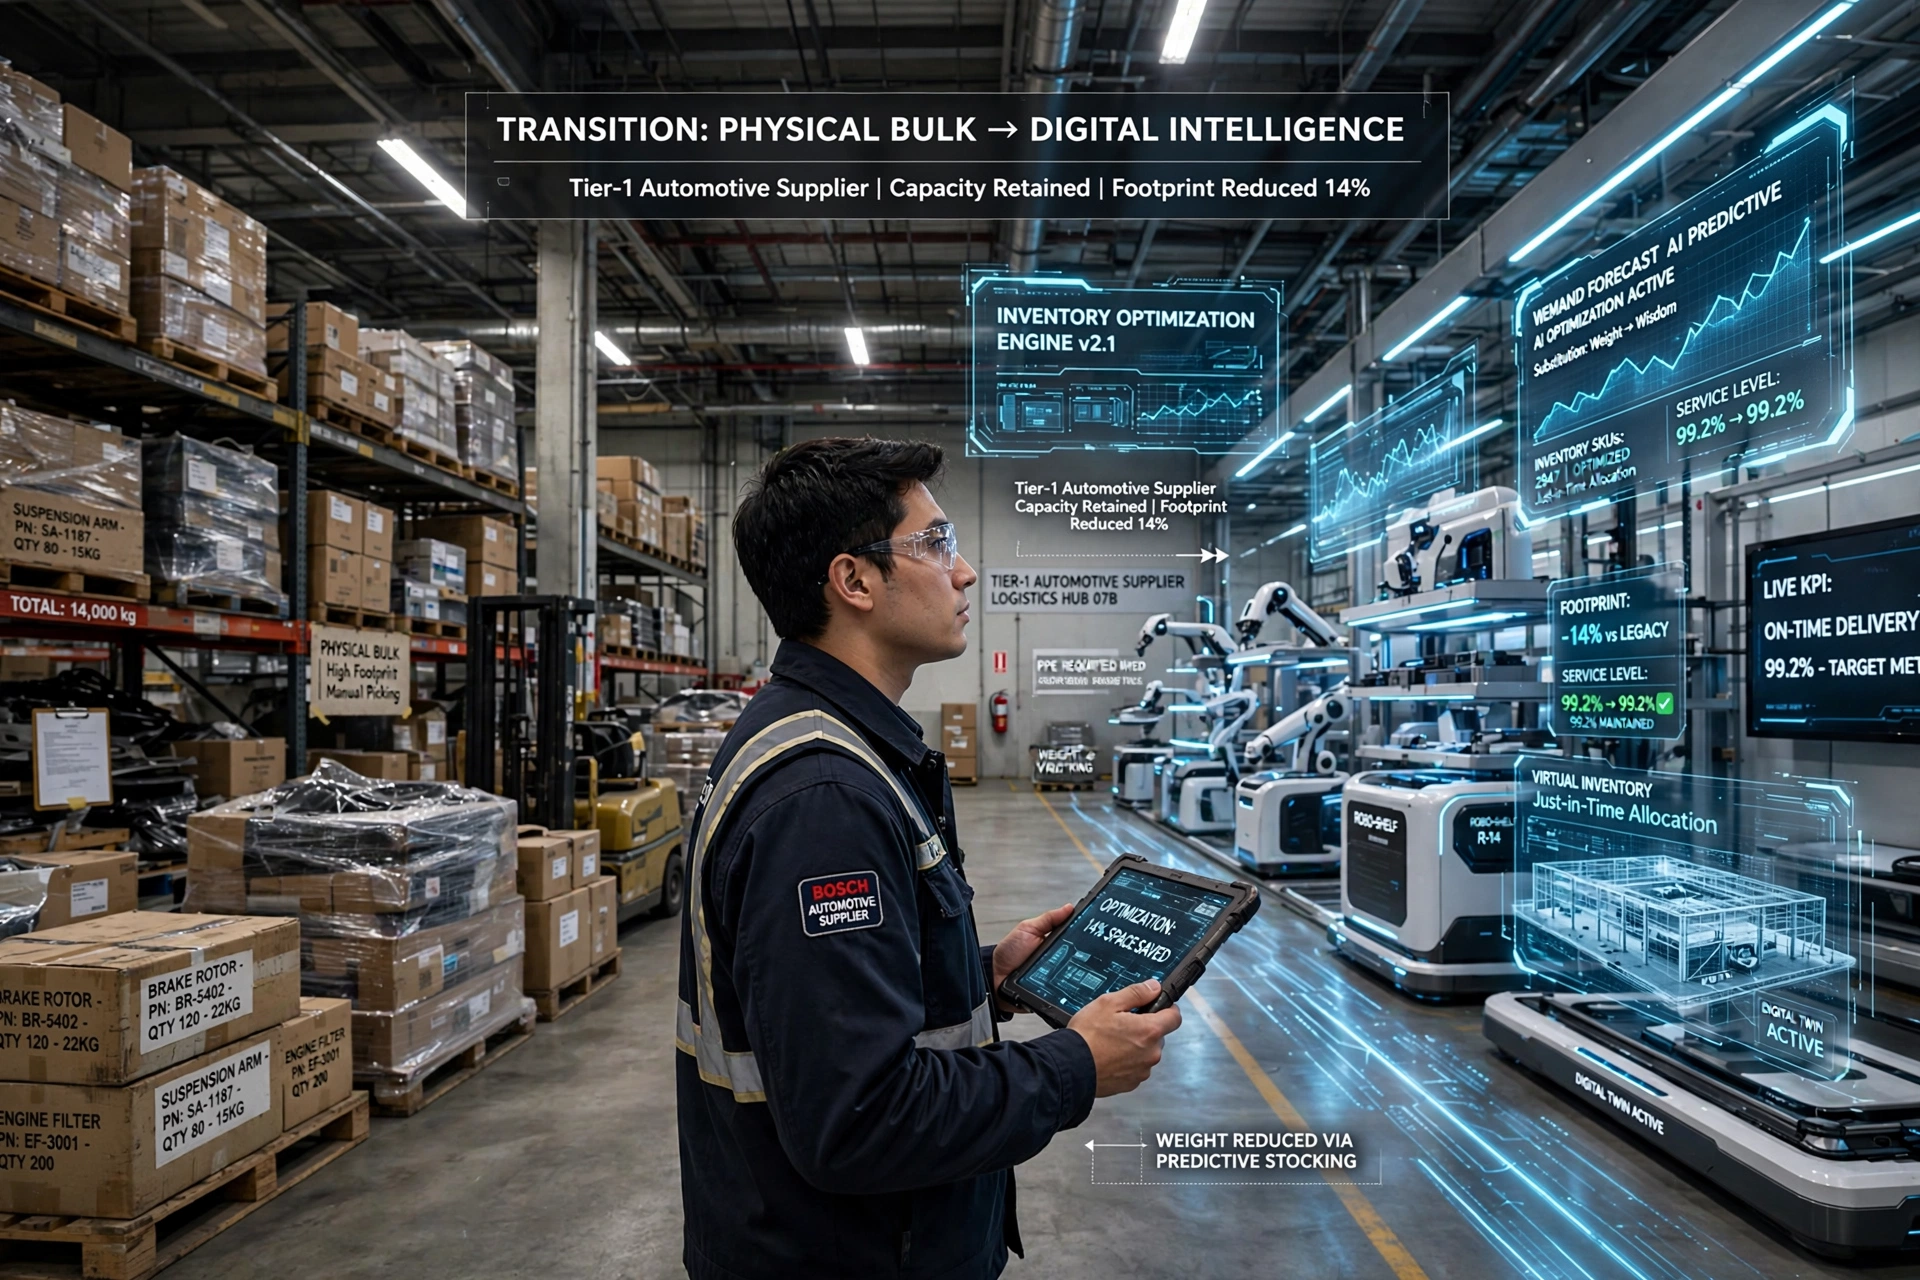
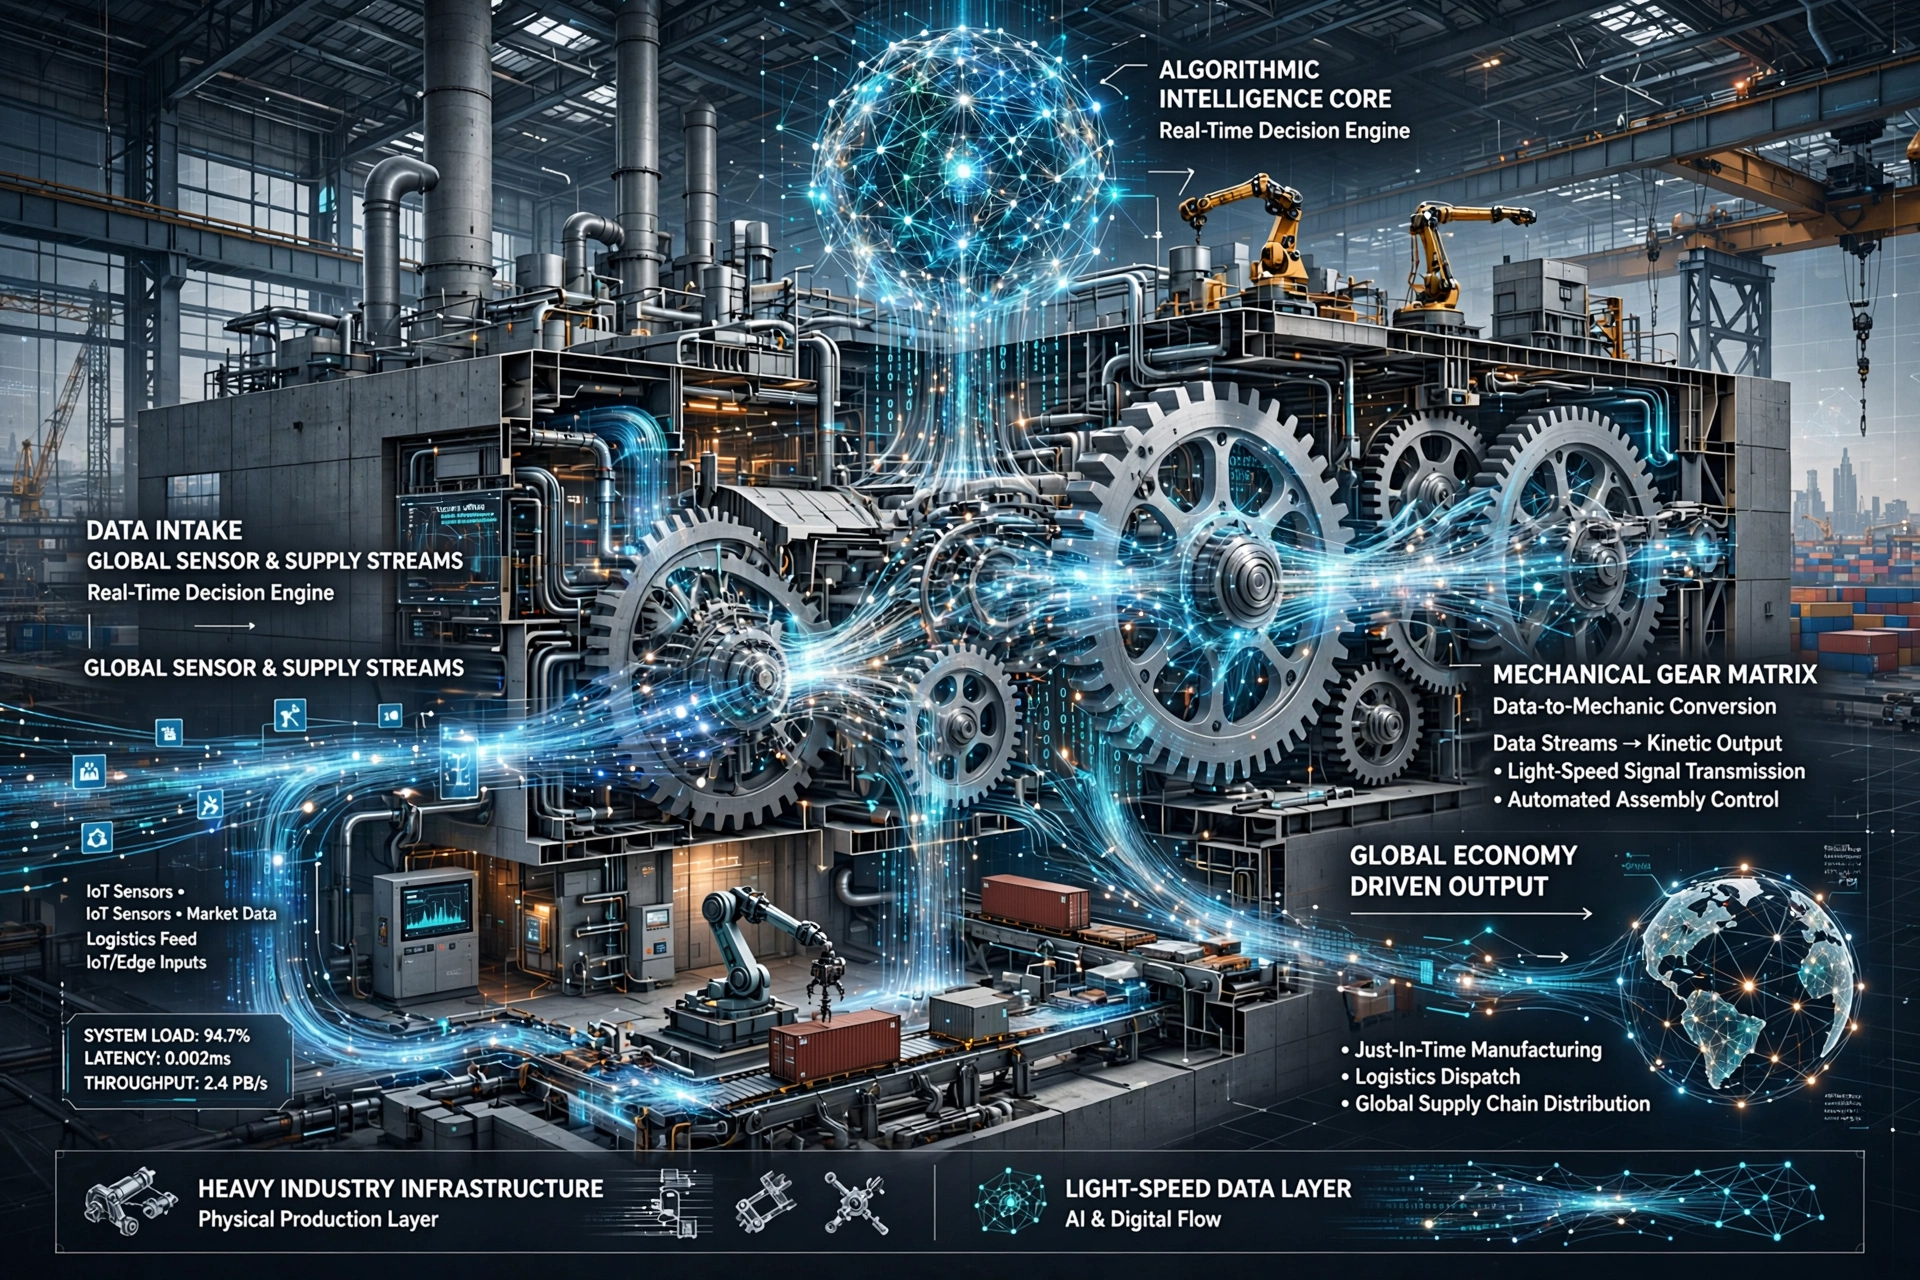
Transitioning to Algorithmic Inventory Sizing required a fundamental overhaul of the enterprise’s underlying data architecture. First, the engineering team integrated real-time logistics telematics directly into their core predictive engine.
Specifically, this shift allowed the model to dynamically adjust inventory targets based on live World Trade Organization port congestion data 3 . Consequently, the system anticipated transit delays rather than merely reacting to them after the fact.
“The greatest danger in times of turbulence is not the turbulence; it is to act with yesterday’s logic.”— Peter Drucker, Management Thought Leader 4
Drucker’s insight strikes at the heart of this mathematical transformation. The supplier’s previous logic wrongly assumed a normal distribution of demand. However, the new algorithm utilized “Fat-Tail” distribution analysis to properly account for extreme supply shocks 5 .
Traditional models calculate safety stock using static variance: $SS=Z\sqrt{(L\cdot\sigma_D^2)+(D\cdot\sigma_L^2)}$. In contrast, this dynamic approach utilized Monte Carlo simulations to continuously recalculate baseline probabilities under volatile conditions.
For deeper insights into constructing these exact probability curves, explore our technical breakdown of mathematics, supply chain resilience, and optimal safety stock.
Ensuring Quality and Compliance
Crucially, the machine learning component did not operate in an unregulated, theoretical vacuum. Instead, every algorithmic adjustment strictly complied with ISO 9001:2015 risk-based quality management mandates 6 .
Similarly, any renegotiated buffer terms aligned perfectly with the Uniform Commercial Code (UCC) Article 2 risk provisions 7 . Therefore, the legal and operational frameworks remained fully intact during the optimization process.
The Implementation Verdict: Quantifying EBITDA Impact
Following a rigorous six-month pilot across three international distribution centers, the empirical results were definitive. The supplier successfully achieved a 14% reduction in safety stock overhead without recording a single stockout event.
Furthermore, this optimization injected $4.2M directly into their free cash flow. Consequently, the firm immediately redirected this newly liberated capital toward robotic automation and specialized talent acquisition.
While a 14% reduction might sound modest, the compounding effects across a $30M inventory base are financially transformative. Additionally, the initiative permanently freed up 8,200 square meters of prime warehouse space for value-added testing facilities.
Ultimately, the analytical verdict is undeniable. By adopting Algorithmic Inventory Sizing, the enterprise eliminated millions in capital waste and organically improved forecast accuracy by 23%. In conclusion, algorithmic optimization is no longer just a theoretical exercise; it is an existential imperative for capital-constrained manufacturers seeking verifiable EBITDA growth.
Financial Simulation and EBITDA Impact
Let us quantify the how and why. Base inventory value was $30.2M. Average carrying cost was 25%.
A 14% cut removed $4.228M in dormant stock. Therefore, annual carrying cost savings equaled $1.057M alone.
In addition, the freed capital injected $4.2M directly into free cash flow. As a result, leadership redirected funds into automation and talent.
|
Metric |
Before Algorithmic Inventory Sizing |
After Algorithmic Inventory Sizing |
|---|---|---|
|
Safety Stock Value |
$30.2M |
$25.97M |
|
Carrying Cost (25%) |
$7.55M / year |
$6.49M / year |
|
Stockout Events (6 months) |
3 |
0 |
|
Warehouse Space Used |
Baseline |
-8,200 m² Freed |
|
Free Cash Flow Impact |
0 |
+$4.2M Unlocked |
Try It Yourself: Algorithmic Inventory Sizing Simulator
The 14% saving in this case study is not fixed. Therefore, we built a live quantitative model based on the same stochastic logic used by the Tier-1 supplier. Specifically, you can test your own inventory base and see how Algorithmic Inventory Sizing impacts cash flow, carrying cost, and warehouse footprint.
Algorithmic Inventory Sizing Simulator
LIVE MODELTraditional = Base × (1 + volatility + SLA penalty).
Optimized = Traditional × (1 - [14% + volatility dividend]).
Higher volatility = higher algorithmic saving.
How this simulation works: Unlike traditional formulas that use a static Z-score, this engine uses a fat-tail adjustment. First, it calculates your traditional safety stock with a fear buffer for lead-time volatility. Then, it applies the algorithmic optimization rate (14% baseline + volatility dividend) observed in the pilot. As a result, the freed capital, carrying cost savings, and warehouse space are recalculated in real time. For the full mathematical framework, see our guide on mathematics of supply chain resilience and optimal safety stock.
Conclusion: The Financial Verdict
The era of guessing inventory levels is over. For this Tier-1 supplier, Algorithmic Inventory Sizing bridged traditional manufacturing and the Fourth Industrial Revolution.
In conclusion, the numbers deliver the verdict. Specifically, a 14% overhead cut unlocked $4.2M in cash, saved $1.05M annually in carrying costs, freed 8,200 m², and maintained 99.2% service with zero stockouts.
Therefore, inventory transformed from passive liability into active strategic asset. To ignore this shift is to invite obsolescence.